Introduction
Mergers and Acquisitions (“M&A”) activity in the technology sector is the subject of an intense debate which has spurred enforcement, regulatory, and legislative activity. Enforcers have brought action against past mergers, such as the acquisitions of Instagram and WhatsApp by Facebook,1The Federal Trade Commission (“FTC”) filed an amended complaint against Facebook (now Meta) in August 2021. First Amended Complaint for Injunctive and Other Equitable Relief, Fed. Trade Comm’n v. Facebook, Inc., No. 20-cv-03590 (D.D.C. Aug. 19, 2021). The case is now proceeding in front of Judge Boasberg. See Isobel Asher Hamilton, The FTC Can Move Forward with Its Bid to Make Meta Sell Instagram and WhatsApp, Judge Rules, Bus. Insider (Jan. 12, 2022, 7:11 AM), https://perma.cc/BEU3-CWHV. and legislators are contemplating significant changes to antitrust laws often aimed at large tech companies.2See generally Jay B. Sykes, Cong. Rsch. Serv., R46875, The Big Tech Antitrust Bills (2021). For example, the Platform Competition and Opportunity Act, which is currently being considered by the U.S. House of Representatives, would prohibit certain digital platforms from acquiring other firms unless they are able to demonstrate that the acquisition will not lessen current or potential competition, nor enhance the platforms’ market power.3H.R. 3826, 117th Cong. (2021). The bill would apply to large or dominant platforms, as defined by the FTC and DOJ. For a more complete discussion of this and other “big tech” antitrust bills currently being considered in Congress, see generally Sykes, supranote 2.
Despite the exceptional focus on reigning in M&A activity in the technology sector, the empirical evidence is incomplete at best. This matters because an outsized regulatory focus on the technology sector could be misplaced. Recent empirical studies include a report by the antitrust subcommittee of the House of Representatives (“Congress Report”),4Staff of H.R. Comm. on the Judiciary, 116th Cong., Investigation of Competition in Digital Markets (2020) [hereinafter Congress Report]. a study of past merger activity of large tech firms by the Federal Trade Commission (“FTC Study”),5F.T.C., Non-HSR Reported Acquisitions by Select Technology Platforms, 2010–2019: An FTC Study (2021) [hereinafter FTC Study], https://perma.cc/75MJ-HTV3. academic papers,6E.g., Ginger Zhe Jin, Mario Leccese & Liad Wagman, How Do Top Acquirers Compare in Technology Mergers? New Evidence from an S&P Taxonomy (Nat’l Bureau of Econ. Rsch., Working Paper No. 29642, 2022). and articles in antitrust trade publications.7E.g., Oliver Latham, Isabel Tecu & Nitika Bagaria, Beyond Killer Acquisitions: Are There More Common Potential Competition Issues in Tech Deals and How Can These Be Assessed?, Competition Pol’y Int’l (May 2020), https://perma.cc/S65Q-JCFY. These studies share a common limitation: a narrow focus on certain firms in the technology sector. As such, they fail to provide a historical perspective, and more importantly, they fail to put the tech industry in the broader context of the U.S. and global economy.8Jin et al. focus on the M&A activity of major tech companies (Google, Amazon, Facebook, Apple, and Microsoft, or “GAFAM” collectively), rather than the tech sector as a whole, as we do. Jin et al., supra note 6, at 6. They compare GAFAM deals to those of other top tech companies, as well as other top companies outside of the tech sector. See id. at 13. Their work identifies several empirical regularities that complement those discussed below. See id. at 37–38.
To remedy this blind spot, we study M&A activity in the tech sector and other sectors of the U.S. economy over time and across countries. Our results suggest that the U.S. tech industry is not disproportionately prone to consolidation relative to its size, as well as relative to other important sectors of the U.S. economy. Furthermore, we find that while the M&A activity in the technology sector has been historically higher in the U.S. than other countries, the rest of the world has been rapidly converging towards a level comparable to that of the U.S. In addition, contrary to a concern shared by many legislators, enforcers, and antitrust practitioners, we do not find that M&As in the tech sector are driven by large firms or prolific acquirers.9For example, the Platform Competition and Opportunity Act discussed above is aimed specifically at curtailing M&As by large digital companies. See H.R. 3826, 117th Cong. (2021). While the debate around the necessity of antitrust reforms, more stringent enforcement, and regulatory intervention specifically tailored to the technology sector is complex, multifaceted, and far from settled, our findings suggest caution against an over-simplified view of the prevalence of M&A activity in the technology sector and the role of large firms and prolific buyers.
I. Standard & Poor Capital IQ M&A Data
Our analyses are based on the Standard & Poor Capital IQ data, a database of mergers and acquisitions maintained by Standard & Poor (“S&P data”). These data track strategic acquisitions across all sectors of the economy in North and South America, Europe, Asia-Pacific, and Africa.10Our analyses encompass all sectors in the data: Industrials, Technology, Media and Telecommunications, Consumer, Health Care, Financials, Materials, Energy and Utilities, and Real Estate. We define country and sector as the country and sector of the target firm. However, results are similar if we use the country and sector of the acquiring firm. The data include several types of transactions, including whole company acquisitions, partial acquisitions, private equity transactions, and real estate investment trusts (“REITs”), as well as asset purchases.11S&P data track strategic transactions that involve a change in the economic ownership of (1) at least 5% of total capital; (2) at least 2% of total capital with a value of US$1M or more; and (3) less than 2% of total capital if the buyer’s stake reaches or exceeds 50% or reaches 100% ownership. The data also include select assets acquisitions, including branches, franchises, divisions, loan portfolios, properties, distribution rights, and certain royalties. In addition to equity acquisitions, coverage includes ancillary transactions such as tender offers for more than a 5% equity stake, debt-to-equity settlements for majority stakes, and others. Our analyses are limited to whole and partial M&A acquisitions.12On average, acquiring firms in the U.S. acquire 95% of the target firms. This figure is similar across industries. The median acquired share of the target firm is 74%, also similar across industries. The FTC study, the Congress Report, and several of the studies referenced above focus on acquisitions in the tech industry from 2010 onwards.13See FTC Study, supra note 5, at 1; Jin et al., supra note 6, at 11; Latham et al., supra note 7, at 2. See generally Congress Report, supra note 4. We follow this literature and analyze all announced acquisitions in all sectors of the economy and all geographies available in the S&P data from January 2010 to December 2021. The lack of information on the size of the deal, which is often not available, is a limitation of the data. As a result, our analyses measure M&A activity based on the count of transactions in various sectors and countries.14Neither sectors nor countries are necessarily relevant antitrust markets. Our analyses may combine firms that are operating in different antitrust markets or separate firms operating in the same antitrust market. We do not focus our analysis only or primarily on M&A deals that are relevant from an antitrust perspective. Instead, we present descriptive statistics over M&As that involve technology companies, as defined below. Furthermore, we rely on the S&P data taxonomy for what constitutes an acquisition in the tech sector, which may be subjective and introduce noise in our analyses. For more on this, see the remainder of this Section and infra Part III.
II. M&A Activity Across Sectors and Countries
Three sectors accounted for half or more of all M&A deals in the U.S. and the rest of the world between 2010 and 2021. The sector with the most acquisitions is the industrials sector,15Industrials include a wide range of companies, from airlines and railroad companies to military weapons manufacturers. Some of the top companies in this sector include UPS, Union Pacific, Honeywell, Lockheed Martin, Deere & Company, Boeing, General Electric, as well as Uber Technologies. which accounts for approximately 22% of all M&A deals in both the U.S. and elsewhere, as shown in Figure 1. The tech sector16The S&P data group technology companies such as Apple, Microsoft, and Alphabet, together with media and entertainment companies such as Disney, Warner Music, and Live Nation, as well as telecommunications companies such as Comcast, Verizon, DISH Network, etc. In this Article, we have separated the information technology firms from the media and telecommunications companies. Throughout the rest of this Article, we will refer to this sector as “information technology,” “technology,” or “tech” sector. Note that Alphabet and Facebook, two of the largest tech companies in common parlance, fall in the “Media & Telecommunications” sector in the S&P data. This, however, does not matter since our analyses are based on the sector of the target firm, not the acquirer. All acquisitions of Alphabet and Facebook of tech companies are included in the tech sector in our analyses. As clarified below, Facebook and Alphabet are indeed two of the largest acquirers of tech companies. ranks second in the U.S. and accounts for 19% of all M&A activity. The consumer sector17The consumer sector includes both discretionary consumer products and services such as cars, jewelry, electronic devices, stays at hotels, etc., and staple products such as food and beverages, household products, etc. Some of the top companies in this sector include Amazon, eBay, Tractor Supply, Wayfair, etc. As explained above, with regard to Alphabet and Facebook, any acquisition of tech companies done by Amazon or eBay is included in the tech sector in our analyses. ranks third in the U.S. and accounts for 17% of all M&As in the U.S. Overall, the share of acquisitions accounted for by the U.S. tech sector is comparable to the share of acquisitions accounted for by other top sectors.
Figure 1: M&A Activity Share by Sector, 2010–202118Deals where S&P Industry Group is “Undefined” are excluded from the analysis. These represent 2% of total deals in the U.S. and 11% of total deals in the rest of the world (“ROW”).
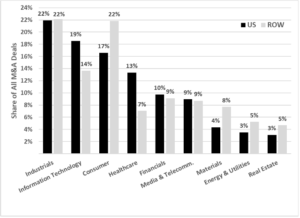
Note that the rank order of the tech sector and the consumer sector is reversed in the rest of the world, and the tech sector accounts for a somewhat lower share of mergers abroad: only 14%. Figure 2, however, shows that looking at the 2010–2021 average share of deals accounted for by the tech sector hides important dynamics as the rest of the world is rapidly catching up with the U.S. More on this below.
To put the percentages in Figure 1 in perspective it is helpful to compare them to the share of total market capitalization accounted for by each sector: the tech sector accounts for approximately 27% of the total market capitalization of firms in the S&P 500 index (see Table 1 below), while the other two top sectors by number of acquisitions—industrials and consumer—account for 8% and 19%, respectively, of total market capitalization.
These percentages do not suggest that M&A activity in the U.S. tech sector is significantly oversized relative to other sectors; while the tech sector accounts for almost a third of the market capitalization in the S&P 500 index, it accounts for less than a fifth of all M&As in the U.S. In contrast, the industrials sector accounts for less than one tenth of the S&P 500 firms market capitalization but accounts for more than one fifth of all acquisitions in the U.S.19It is possible that the tech sector accounts for a much larger share of the value of M&A deals. However, the S&P data do not allow us to check for this eventuality.
Table 1: Total S&P 500 Market Capitalization by Sector20Data reflect market capitalization of the 505 constituents of the S&P 500 as of March 2022.
| Market Cap ($T) | % of Market Cap | |
| Information Technology | 11.1 | 27% |
| Consumer | 7.8 | 19% |
| Health Care | 5.3 | 13% |
| Financials | 4.7 | 12% |
| Media & Telecomm. | 4.1 | 10% |
| Industrials | 3.2 | 8% |
| Energy & Utilities | 2.6 | 6% |
| Real Estate | 1.0 | 3% |
| Materials | 1.0 | 3% |
| Total S&P 500 Market Cap | 40.8 | 100% |
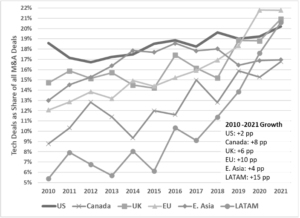
One limitation of Figure 1 is that it overlooks significant differences in the evolution of tech acquisitions across countries over time. Figure 2 below remedies this shortcoming and illustrates how the tech share of M&A deals has changed from 2010 to 2021 in the U.S. and other regions. For example, in the U.S., the share of all M&A deals accounted for by the tech industry has stayed roughly constant, increasing by less than two percentage points in the past ten years, from slightly less than 19% in 2010 to about 20% in 2021.
This has not been the case in other geographies, where the share of all M&A deals accounted for by the tech sector has increased rapidly. In the EU, the share of M&A deals accounted for by tech firms has almost doubled, from 12% in 2010 to almost 22% in 2021. In Latin America (“LATAM”), the share of tech has grown fourfold, from 5% to more than 20%, during the same period. In Canada, this figure has grown eight percentage points, from 9% to 17%. In the UK, it has grown from 15% to almost 21%. While technology companies have been historically more active in the U.S., this analysis suggests that the rest of the world is catching up with the U.S. As of 2021, the tech sector represented a slightly larger share of all mergers and acquisitions in the EU, UK, and Latin America than in the U.S.
Figure 2: Tech Share of Overall M&A Activity in
Selected Geographies over Time, 2010–2021
III. M&A Activity by Big Firms
Several antitrust practitioners, legislators, and enforcers have expressed concerns about acquisitions by large digital companies. Some have suggested that acquisitions are large platforms’ preferred way to grow and acquire market power.21Diana L. Moss, Gregory T. Gundlach & Riley T. Krotz, Market Power and Digital Business Ecosystems: Assessing the Impact of Economic and Business Complexity on Competition Analysis and Remedies, Am. Antitrust Inst. (June 1, 2021) (“Growth through acquisition appears to be the major strategy for implementing the [Digital Business Ecosystem] business model.”),
The Congress Report focuses on Facebook, Google, Amazon, and Apple.22See Congress Report, supra note 4, at 10. The FTC Study analyzes non-HSR reportable acquisitions by Google, Apple, Facebook, Amazon, and Microsoft.23The Hart-Scott-Rodino (“HSR”) Antitrust Improvements Act of 1976 requires parties that meet certain transaction size and other tests to file premerger notification forms for mergers and other transactions with both the Federal Trade Commission and Department of Justice Antitrust Division. See 15 U.S.C. § 18(a). The FTC study reviewed transactions that were not previously analyzed under the HSR notification system. FTC Study, supra note 5, at 1. Several of the other empirical studies mentioned earlier focus on the acquisition patterns of the largest tech firms.24See, e.g., Jin et al., supra note 6, at 6. We use the S&P data to explore whether large buyers drive consolidation in the tech sector and whether they do so more than large buyers in other sectors of the economy. We study this question by looking at two alternative definitions of large buyers. First, we look at the most prolific buyers in each industry (i.e., the firms that account for most acquisitions in a given sector between 2010 and 2021). Second, we look at the largest companies, according to their market capitalization in 2022, in each sector.
A. M&A Activity by the Most Prolific Buyers
Table 2 below reports the share of deals in each industry where the buyer is one of the most prolific buyers. This index captures how much the acquisition activity in each industry is driven by the companies that have been more active in the M&A market. A higher number indicates a more “concentrated” buying activity in the industry25This index is analogous to certain concentration measures (for example, the four-firm concentration ratio) often used to evaluate concentration in any given industry. The key difference is that, rather than looking at concentration in a product or service market using market shares, we are looking at concentration in the M&A market using share of acquisitions. and provides empirical support for the notion that certain firms are driving the consolidation in the industry.
Acquisitions in the tech industry are not particularly concentrated: the top five most prolific buyers in tech account for 2.3% of all deals in the industry, and the top twenty most prolific buyers account for 5% of all deals. Other industries appear to have more concentrated M&A activity. For example, the top five most prolific buyers in real estate account for almost 5% of all acquisitions—twice as much as in the tech industry. Furthermore, several of the industries that are ranked closely to the tech sector in the table below, report M&A concentration levels that are hardly different from the corresponding figure for the tech industry. For example, for Energy & Utilities, Health Care, and Media & Telecommunications, the share of acquisitions done by the top five most prolific buyers in the industry is within half a percentage point of the corresponding figure for the top five tech companies. By this measure, M&A activity in tech does not appear to be driven by a handful of prolific buyers; in any case, not disproportionately so, relative to other sectors in the economy.
Table 2: Share of M&A Deals by Top Buyers, 2010–202126The top 20 most prolific buyers in tech—from the most to the least active—are Alphabet, Microsoft, IBM, Oracle, Cisco Systems, Salesforce.com, Broadcom, VMware, Roper Technologies, Apple, Intel, Meta, Accenture, Amazon, Trimble, Intuit, Adobe, Citrix Systems, Synopsys, and Twitter.
| Share of Total Deals by Top Buyers | ||||
| Sector | Top 5 | Top 10 | Top 15 | Top 20 |
| Real Estate | 4.8% | 6.5% | 7.6% | 8.5% |
| Financials | 3.0% | 3.8% | 4.4% | 5.0% |
| Energy & Utilities | 2.5% | 4.3% | 5.7% | 6.9% |
| Information Technology | 2.3% | 3.6% | 4.4% | 5.0% |
| Health Care | 2.2% | 3.4% | 4.3% | 5.0% |
| Media & Telecomm. | 1.8% | 2.9% | 3.7% | 4.2% |
| Materials | 1.7% | 2.9% | 3.7% | 4.4% |
| Industrials | 0.9% | 1.5% | 1.9% | 2.3% |
| Consumer | 0.7% | 1.2% | 1.6% | 1.9% |
| Undefined | 1.2% | 2.0% | 2.7% | 3.4% |
Table 2 above provides a snapshot view of how concentrated acquisitions were in each industry in the past ten years. Next, we evaluate whether M&A activity by the most prolific buyers has been increasing over time, as this could also be a prima facie cause of concern for those who believe that a handful of prolific buyers are consolidating the tech industry. Figure 3 below shows that the share of M&A deals accounted for by the most prolific buyers in tech has been decreasing over time, regardless of whether one looks at the most prolific five, ten, fifteen, or twenty buyers. In 2021, the top twenty buyers in tech accounted for less than 4% of all M&As in the technology sector, down from 10% in 2010.27In this analysis, all acquisitions have the same weight. The data do not allow us to calculate similar shares using the value of each deal.
Figure 3: Share of M&A Deals by the Most
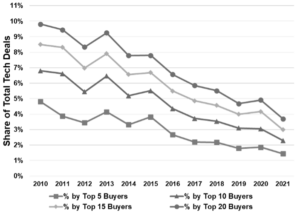
Prolific Buyers over Time, 2010–2021
B. M&A Activity by the Largest Firms
Next, we examine whether consolidation in the tech industry is driven by the largest tech firms, per their market capitalization in 2022.28If the policy or enforcement concern is that large tech companies have used acquisitions in the past ten years to grow and dominate their respective markets, use of the latest available market capitalization reflects a conservative approach to analysis because it includes more of the firms that have indeed relied on the buy-to-grow strategy. Table 3 and Figure 4 below are analogous to Table 2 and Figure 3 above and show whether large tech firms account for a disproportionate share of tech acquisitions and whether their M&A activity has been growing over time.29Table 3 and Figure 4 show the share of tech companies acquired by market capitalization by the top tech companies. The analysis reflects deals where both the target and the acquirer are tech firms, per the S&P data. The goal is to analyze the acquisitive behavior of the largest tech companies. The analysis presented in Table 2 and Figure 3 instead focuses on the top acquirers of tech companies, regardless of whether the acquiring firm is a tech company or not. However, as illustrated above, virtually all the top acquirers of tech companies are themselves tech companies.
Table 3: Share of M&A Deals by Largest Firms, 2010–202130The largest tech firms are Apple, Microsoft, Visa, Mastercard, Nvidia, PayPal, Intel, Adobe, Oracle, Broadcom, Salesforce.com, Cisco Systems, Texas Instruments, Qualcomm, Block, Intuit, Zoom Video Communications, Applied Materials, ServiceNow, and IBM. This list is based on average market capitalization as of YTD March 2022 and is noticeably different from the list of top acquirers of tech companies presented in note 26. This list includes firms that are not typically considered technology companies, such as Visa and Mastercard, and excludes some familiar names such as Facebook/Meta, Google/Alphabet, or Amazon. The former two are classified by the S&P data in the Media & Telecommunication sector while the latter falls in the Consumer sector. While it is often a challenge to classify any specific firm in a particular sector, especially those whose business activities may span multiple sectors or firms that rely heavily on software but operate in traditional industries such as retail or payment processing, the fact that our results do not change based on the inclusion or the exclusion of these companies suggests that the patterns presented in this Article are not driven by any specific definition of “tech” firm adopted.
| Share of Total Deals by Largest Firms | ||||
| Sector | Top 5 | Top 10 | Top 15 | Top 20 |
| Health Care | 2.0% | 2.9% | 3.5% | 4.2% |
| Media & Telecommunications | 1.4% | 2.2% | 2.6% | 3.2% |
| Energy & Utilities | 1.4% | 2.5% | 3.5% | 4.6% |
| Information Technology | 0.9% | 1.9% | 2.8% | 3.4% |
| Financials | 0.4% | 0.7% | 1.4% | 2.2% |
| Materials | 0.3% | 0.8% | 1.8% | 2.5% |
| Real Estate | 0.3% | 0.7% | 1.3% | 2.1% |
| Consumer | 0.2% | 0.3% | 0.4% | 0.5% |
| Industrials | 0.2% | 0.5% | 0.5% | 0.8% |
| Undefined | 0.0% | 0.0% | 0.0% | 0.0% |
Figure 4: Share of M&A Deals by Largest Firms Over Time, 2010–2021
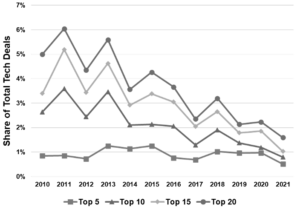
Our previous result, that large buyers do not drive acquisitions in the tech sector more than other sectors of the economy, is robust in comparison to this alternative measure of “bigness”: Table 3 shows that the top five largest firms in the tech sector account for less than 1% of all acquisitions in the industry. This is less than the corresponding share in Health Care, Media & Telecommunications, and Energy & Utilities. Results are similar if we look at the top twenty firms in the industry.
Figure 4 shows that the share of acquisitions accounted for by the top five largest firms has been stable at 1% over the last ten years, while the share of acquisitions for all other top firms has decreased over time.
Conclusion
We study the M&A activity taking place between 2010 and 2021 in the U.S. and several other regions and compare the tech sector to other large parts of the economy. We ask whether consolidation in the U.S. tech industry is anomalous relative to other sectors or other regions. Evidence of unusual M&A patterns in the U.S. tech sector would be consistent with concerns expressed by several observers that the tech industry may require additional legislative or regulatory intervention or more stringent enforcement.
Our results indicate that from an M&A standpoint, the U.S. tech sector is not more active than other large sectors in the economy. Furthermore, while in the past ten years the U.S. has had a larger tech M&A market relative to the rest of the world, other regions are rapidly catching up. Importantly, we do not find that large or prolific buyers account for a disproportionate amount of M&A deals in the technology sector.
Our analyses put the tech sector in the broader context of other sectors and other geographies. Our findings do not indicate that certain acquisitions in the tech industry (or elsewhere in the economy) do not have anticompetitive effects or do not cause consumer harm. Each acquisition needs to be evaluated on its merit by the antitrust enforcers and the courts. Nor do we believe that efforts to modernize antitrust enforcement are necessarily misguided. The debate on the role of large tech companies in the economy goes beyond antitrust enforcement and competition policy and touches a wide range of topics, including consumer privacy, freedom of speech, and the effect of social media on teen development and mental health. Yet, our results suggest that some of the assumptions that inform much of the conversation around “big tech” may be misinformed. Legislative and regulatory interventions targeting mergers and acquisitions in the tech sector may have unintended consequences and transfer resources from the more innovative, dynamic, and productive parts of the economy to other, less dynamic and less productive sectors, rather than address an antitrust problem.