Introduction
In recent years, income inequality and antitrust enforcement have been repeatedly linked in popular and policy discussions. Particularly as the COVID-19 pandemic shocked and dramatically reshaped daily lives across the world, concerns regarding economic inequality have surged.1See, e.g., Carmen Sanchez Cumming, Raksha Kopparam & Maryam Janani-Flores, The Economic State of the Union in 2022, Presented in 11 Charts, and What Policymakers Can Do to Make the Recovery More Equitable and Resilient, Wash. Ctr. Equitable Growth (March 1, 2022), https://perma.cc/T3ZS-CQEQ. Simultaneously, as the pandemic increased global reliance upon technological tools—already the topic of significant debate regarding appropriate antitrust enforcement—and catalyzed disruptions along all manner of supply chains, created various shortages, and drove price increases, the appropriate role of antitrust laws once again reemerged as a critical topic of discussion. It was perhaps inevitable that the two phenomena would be linked in policy discussions.
Indeed, the nature of a causal link between income or wealth inequality and antitrust is longstanding, though surprisingly underexamined. Since early in the twentieth century, the U.S. Government sought to examine the supposed “intimate relation” between income distribution and monopoly power.2Temp. Nat’l Econ. Comm., 76th Cong., Investigation of Concentration of Economic Power 1 (Comm. Print 1940) [hereinafter TNEC Concentration]. In the decades since, this intimate relation has been invoked repeatedly.
Today, again, arguments that antitrust enforcement might affect the distribution of income and wealth have reemerged. Literature examining the income distribution in the U.S. over the last century or so has demonstrated that since at least 1980, the distribution of income has become increasingly skewed. The “college premium”—“that is, the relative wage of college versus high-school educated workers”3Daron Acemoglu & David Autor, Skills, Tasks and Technologies: Implications for Employment and Earnings 7 (Nat’l Bureau of Econ. Rsch., Working Paper No. 16082, 2010),
https://perma.cc/D4QY-J938..—has grown in recent decades, as have the share of income flowing to the top 1%, job polarization, and wage polarization.4Ramaa Vasudevan, The Rise of the Global Corporation and the Polarization of the Managerial Class in the U.S., 29 Rev. of Pol. Econ. 539, 539 (2017). The trend, then, has been toward an increasingly unequal income distribution.
At the same time, antitrust enforcement embraced and implemented the consumer welfare standard. This standard judges alleged violations of the antitrust law by one key metric: how the conduct affects consumer welfare. Critics of this standard contend that it has impaired the power of antitrust enforcers in undesirable ways; that it has caused a decrease in antitrust enforcement rigor.5A. Douglas Melamed, Antitrust Law and Its Critics, 83 Antitrust L.J. 269, 271–74 (2020). Some further argue that this decline in antitrust enforcement is contributing to inequality trends and concerns.6Id. at 280–82. And ramping up antitrust enforcement could help to reverse them.7Id. at 274–75.
Despite how vocal these arguments have become, the question of whether or how much increased antitrust enforcement might affect the distribution of income, or might impact recent observed trends, seems comparatively underexplored.
Regardless of how one evaluates the existence or a particular level of inequality, it is instructive to investigate any trend of increasing income inequality—especially when that trend leads to an increasingly polarized job market, with more extremes and a smaller center, and when there was never an explicit intent to create such a trend. During this time period, there has been much debate over how to generate more wealth across the economy—for example, what policies and approaches best spur growth—but not a specific desire to create more wealth for the top of the income distribution while simultaneously reducing wealth for the lower distributions.
For a functioning, healthy free market system to survive, there are many reasons to be wary of extreme levels of inequality.8Joseph E. Stiglitz, The Price of Inequality ix–xxiv (2012). Over several decades we might expect to see fluctuations in inequality, likely increasing and decreasing at different time periods. But a steady trend toward inequality, with no meaningful trend away from it, should provoke serious conversations regarding what is—and what is not—driving that trend. And, potentially, when the causes of that trend are better understood, as to how to reverse or slow it. We do indeed see many of these conversations happening today.
Both phenomena—rising income inequality and diminishing antitrust enforcement—are complex and nuanced. Properly understanding them and navigating a viable path forward demands a deeper understanding of the landscape of each and the interplay between the two. Antitrust commentaries to date fail to grapple with the specifics of what is happening in the income inequality space and how the two alleged trends might be related or reinforcing.
The goal of this Article is to understand better the capacity of antitrust law and policy to affect inequality trends and to begin the work of ascertaining its role in contributing to recent income inequality trends. It is generally agreed that individual antitrust cases have distributional effects. But the causal link between antitrust enforcement and inequality, writ large, remains underdeveloped and underexplored. There is a robust literature exploring trends in income distribution which would seem to provide ample ground for developing the relationship between inequality trends and antitrust enforcement.
Before diving into the analysis, there is a relevant distinction: antitrust’s role in affecting trends on personal income versus individual consumption. Antitrust might be relevant on the income side, in terms of correcting market failures that would put more capital into the hands of those in the mid to lower portions of the income distribution. Consider, for instance, if employers hold monopsony power and are paying anticompetitive wages and antitrust enforcement is able to correct that behavior.
Antitrust might also be relevant on the consumption side—in terms of making goods and services more affordable or accessible to those on the lower half of income the distribution. Antitrust’s consumer welfare standard aims to make “consumers” as a broad category better off. But it tends not to ask whether, when those consumers are better off, precisely how those benefits are distributed across consumers—whether to wealthier or less wealthy, equally or disproportionately in one direction or another. Equality effects, specifically, are a consequence about which antitrust has historically been agnostic. As will be explored, there are important scenarios in which benefits have important progressive effects. Thus, there is a question of whether steps can be deliberately taken to achieve progressive benefits and whether doing so can have an impact on the inequality trends we are observing.
This Article uses income inequality as a particular focus for several reasons. Income distribution is especially well-explored and scrupulously analyzed, meaning there is a particular story to follow and potential insights to glean that might be relevant from an antitrust perspective. Moreover, income is, for most people, a critical component of economic wellbeing and a contributor to consumption capacity.
There are three primary theories as to how monopoly power and concentration might be contributing to inequality trends. First, the monopoly overcharges story, perhaps the most direct storyline. Here, a reduction in output or increase in price harms consumers. Such a reduction in output or increase in price is allegedly more harmful to lower-income consumers, who are more sensitive to such fluctuations, and thereby contributes to wealth gap. Second, the shareholder returns story. Beneficiaries of monopoly overcharges tend to be those who are disproportionately higher-income, thereby contributing to wealth inequality. Third, the employer monopsony power story. Here, powerful employers can offer lower wages, and that these wages disproportionately affect those of lower income distribution.
These theories raise questions relating to issues such as the distribution of monopoly overcharges and rents across the economy and income distribution, and whether employer-side power has changed in recent years such that they might be deploying their market power in ways that contribute to observed trends. This Article considers these questions and more.
Part I summarizes the income inequality literature, to provide a more detailed basis upon which to analyze the potential effect of antitrust enforcement across the period examined. Part II describes general antitrust law and enforcement trends since 1890, setting the stage for a comparison of the trends in antitrust and those observed in income distribution. Part III explores the connection between these trends. Part IV deploys these insights to consider the redistributive power of antitrust law. The work is a first step toward a richer understanding of how antitrust law and policy might contribute to income inequality trends and, ultimately, of whether changes in law, policy, or priorities might better facilitate desired goals.
I. Income Inequality Trends
Over the last several decades, empirical work on income inequality has contributed to our understanding of existing trends and potential causes. Various factors, including technological developments, globalization, and societal and political rules and norms have been explored, and seem likely to have contributed in different magnitudes over time. But as Nobel laureate Joseph Stiglitz noted, there is also “a growing consensus among economists that it is hard to parse out cleanly and precisely the roles of different forces.”9Id. at 80; see also Anthony B. Atkinson, Thomas Piketty & Emmanuel Saez, Top Incomes in the Long Run of History, 49 J. Econ. Lit. 3, 56 (2011) (“[E]xplanations are likely to be multivariate and we are confronted with the task of seeking to separate different influences.”). Some have suggested that doing so might, largely, be unnecessary at this point.10Stiglitz, supra note 8, at 80 (“To me, much of this debate is beside the point.”).
But certainly, some amount of understanding of the roles different forces play is important when it comes adopting (or not adopting) specific policy and legal actions. Such efforts require identifying areas most likely to achieve the ends desired, and thus are worthy of focus. Tradeoffs will inevitably need to be made. We would be best served to begin from an informed position.
As this Section develops, there has been considerable work documenting income inequality trends and attempting to distill causes. This Article argues, however, that one comparatively underdeveloped area is the impact of antitrust law and policy—what role it has played and what is its capacity to affect inequality (on a broad scale or on income inequality more specifically). While the literature to date reveals several factors that have contributed significantly (see below), the literature has yet to reveal the role of antitrust.
The debate regarding what is occurring, broadly, to drive inequality and how best to characterize the trends or their consequences, is largely outside the scope of this Article. The goal here is to compile foundational evidence relating to income inequality in one place, with a particular focus on the work that has been done with the highest potential relevance for antitrust policy.
A. Introduction to Early Income Inequality Literature and Findings
Today, one takes for granted the wealth of research into the existence, causes, and consequences of earnings inequality. The last few decades have witnessed an explosion of literature in this field. As Levy and Murnane noted in 1992, “within a decade, earnings inequality grew from a lightly studied branch of labor economics to a major research area.”11Frank Levy & Richard J. Murnane, U.S. Earnings Levels and Earnings Inequality: A Review of Recent Trends and Proposed Explanations, 30 J. Econ. Lit. 1333, 1334 (1992). They credit two particular observations with catalyzing this change: (1) diminishing middle class jobs, and (2) an increasing “skills mismatch” in the economy.12Id. at 1334–35. Scholars continue to explore these themes to this day.
The data reveal changing levels of income inequality and the share going to the top earners, both increasing and decreasing through most of the twentieth century.13Emmanuel Saez & Gabriel Zucman, The Rise of Income and Wealth Inequality in America: Evidence from Distributional Macroeconomic Accounts, 34 J. Econ. Persps. 3, 10 (2020). As Goldin and Margo put it, the wage structure was on a “long-run roller coaster ride” from the 1940s through the late 1980s.14Claudia Goldin & Robert A. Margo, The Great Compression: The Wage Structure in the United States at Mid-Century, 107 Q.J. Econ. 1, 3 (1992) (“The wage structure . . . has been on a long-run roller coaster ride since 1940—with inequality falling precipitously during the 1940s, rising slightly in the 1950s and 1960s, and finally increasing sharply from the 1970s.”). Over the last few decades, however, the income inequality levels have been trending (fairly consistently) in an upward direction.15Saez & Zucman, supra note 13. The key findings from the literature conclude that: income inequality has increased fairly continuously since at least the 1980s (rapidly and then more slowly); this increase is not being driven by gender or racial factors; rather, it is primarily driven by trends among the top 1%, and even the top 0.1%, which is consistent with how these top earners affect longer term trends; and the “college premium” has increased significantly in recent years. A key result observed today is polarization in the workforce, both in terms of earnings and in terms of occupations.
The “beginning” in terms of research into U.S. income inequality trends is typically around 1913, which marks the start of the modern income tax era. Significant literature and popular discussion today focus upon the very top earners—the top 10 or even 1%. Even early studies of inequality focused upon the top decile due to historical limitations (prior to 1944 changes, only a small percentage had to file tax returns).
A report of the Temporary National Economic Committee (“TNEC”) published in 1940 represents one of the earliest publications addressing the concentration of income in the U.S.16See TNEC Concentration, supra note 2. That report examined the period between 1918 and 1937 and concluded that income inequality was lowest in 1920 and 1932 and highest in 1928 and 1929, with “no significant trend over the period as a whole.”17Id. at 16–17. The TNEC examined concentration of income for the highest 2% of earners (all that the data permitted), and divided that further into smaller and smaller subsets down to the highest 0.01%, five in total.18Id. at 16–23. The report noted that trends in the earlier and later years were very similar: the average total share of income received by the top 1% of earners was roughly 13% in the years 1918 to 1924 and in the years 1934 to 1937.19Id. Meanwhile, this share peaked in 1928 to 1929, at about 19%.20Id.
The report further found that the shares going to top earners declined more during periods of business depression and increased more during periods of business prosperity than the shares received by the more inclusive groups.21Id. at 35–36. This latter point—whether the very top income earners are more (or less) impacted by economy-wide experiences—will reemerge in later periods, as well. But the general consensus for this particular time period is that inequality trends were driven primarily (if not exclusively) by the country’s economic fate: with inequality increasing during economic boom years and decreasing during economic down years and war years.
The TNEC Report was commissioned to address “the intimate relation of the distribution of income to monopoly and the effectiveness of competition in general.”22TNEC Concentration, supra note 2, at 1. On the issue of monopoly and income trends, the report argued that “[i]t may be confidently stated that were it not for past and present monopoly in one form or other, the prevailing distribution of income would be considerably more equal.”23Id. at 2. In particular, it credited:
Rising land values; poorly organized markets; control of natural resources such as oil, copper, aluminum, and timber or of important stages in their fabrication; railroad development; strategic positions in the Nation’s financial markets; promotions of consolidations in industry; monopolistic practices and conditions in industries such as steel and tobacco; and the rapid expansion of new industries such as agricultural machinery, electrical appliances, motion pictures, chemicals, and radio—all these situations provided the basis for many of the large fortunes and in all of them strong elements of monopoly are found.24Id. at 1.
The report also concluded that incomes stemming from monopolistic conduct yield financial power used to further consolidate industry control and, “[i]n this way, the relationship between the concentration of income and industrial monopoly has tended to be interacting and cumulative.”25Id. Many of the arguments made today regarding income inequality and antitrust echo this same sentiment.26Note that because the data analyzed relate to top incomes, the report necessarily focuses upon the alleged relationship between those top incomes and monopoly concerns..
The report cautioned that, “[t]his is not to say that increasing the effectiveness of competition would yield equal incomes for all.”27Id. at 2. Rather, a “considerable degree of income inequality seems to be consistent with a high degree of competition and is probably an essential characteristic of a competitive economy.”28Id. at 2. Thus, the TNEC argued in favor of reducing monopoly practices to increase competition and income equality—but acknowledged that both monopoly and competitive outcomes are consistent with income inequality, perhaps even a significant amount. This important point is one with which the literature continues to struggle today. In discerning the distinctions between competition and monopoly, or between desirable and undesirable, market situations. While some situations fall clearly into one category or another, many others do not. And as this proposition makes clear, the distinction is important—both to how income inequality should be understood and to how, if at all, it should be addressed.
The notable income distribution event that followed this early period of stability29See Thomas Piketty & Emmanuel Saez, Income Inequality in the United States, 1913-1998, 118 Q.J. Econ. 1, 25 (2003) (“Top wage shares show a striking stability from 1927 to 1940.”). has been coined the Great Compression.30Goldin & Margo, supra note 14. This designation describes the period in the 1940s during which the wage structure narrowed considerably, and quickly. It also marks a period during which income inequality in the U.S. remained meaningfully below the levels seen in the preceding decades or those which followed—a period sometimes referred to as the Golden Age for income inequality.31Levy and Murnane, for instance, draw a parallel to Angus Maddison’s description of this period as the postwar “golden age” for productivity, arguing that the “onset of the Great Depression caused a break in trend as earnings inequality entered its own ‘golden age.’” Levy & Murnane, supra note 11, at 1340.
Goldin and Margo examined this period in depth to explore what was happening to wages and what was driving these changes. They note the wage structure narrowed significantly between 1940 and 1950, then began widening from 1950 to 1987 (the last year for which they had data).32Goldin & Margo, supra note 14, at 3, 8. They find that compression occurred in both the upper and the lower tails—perhaps explaining why the drop in inequality was so significant.33Id. at 27 (“The main finding is that wage compression in the upper range of the distribution (measured by the difference in the log of the wage at the ninetieth and fiftieth deciles) occurred during the war and continued long after wage controls ended, a finding from the clerical data as well (see Table VII). Compression in the lower portion of the distribution (from the tenth decile to the median) was generally strong in the prewar to war period but less strong in the war to postwar period, despite the continued rise of the minimum wage.”).
They identify several factors as likely motivators. While inequality was narrowing in the 1930s, this narrowing was far more modest and, they posit, driven largely by the minimum wages set by the National Industrial Recovery Act (“NIRA”).34Id. at 16. Their findings imply that “factors unique to the World War II period [] explain much of the initial compression.”35Id. This included governmental wartime policies, like the National War Labor Board (“NWLB”).36Id. at 23–28. The war likely also contributed to an increased demand for less-skilled manufacturing labor—although the data indicates this demand increased from the 1940s through the early 1960s, well after the war had ended.37Id. at 28 (“The upper tail of the distribution, even in relatively high wage and nonwar related industries, also narrowed considerably during the war. This fact, in combination with the relative stability in the wage structure from 1949 to 1959, bolsters the notion that market forces increased the demand for less-skilled manufacturing workers on a continuing basis from the 1940s to the early 1960s and served to keep in place a wage structure that was initially necessitated by the wartime economy and mandated by the command economy.”).
During this time, the college premium dropped significantly: between 1940 and 1950 the premium to college over high school graduation experienced a thirteen percentage point decline.38Goldin & Margo, supra note 14, at 6–8. It began rising again during the 1950s; but remained below the 1940 level in 1960.39Id. at 8. Meanwhile, supply of college-educated workers increased significantly heading into the 1950s, as many veterans took advantage of the GI Bill provision for college attendance.40Id. at 30–31. While demand for educated workers was increasing into the 1960s, it took some time for the college premium to rebound.41Id. at 29 (“[W]age compression in the 1940s between the lesser and more educated groups is, perhaps, no mystery. Relative demand stayed virtually constant, while relative supply increased. In the 1950s the supply of college-educated workers continued to increase faster than that of less-educated workers, while the growth in the relative demand for the more educated greatly exceeded that for the less educated. These demand effects continued into the 1960s, and the wage compression of the 1940s eventually began to unravel.”).
Goldin and Margo conclude:
The Great Compression, as we have called it, was primarily the result of a particular confluence of short-run events affecting the demand for labor and of institutional changes brought about by the war and the command economy that accompanied it. . . . compression was observed at the industry level during the period from the mid-1940s to the early 1950s, and compression occurred in both the upper and lower tails of the distribution.42Id.at 32.
This compression period is critical to the income inequality story. It marks a period of rapid, striking reduction in income inequality not observed before or since.43See, e.g., Piketty & Saez, supra note 29, at 33 (“The pattern of top shares over the century is striking: most of the decline from 1927 to 1960 took place during the four years of World War II. The extent of that decline is large, especially for very high wages.”); Levy & Murnane, supra note 11, at 1340 (“By the early 1950s, the trend of rapidly declining inequality had ended and the economy began a period of almost three decades in which inequality rose slightly.”). Income inequality remained fairly stable for the next few decades, then began climbing.
B. Recent Trends: The Increasing College Premium and Wage and Job Polarization
Since the Great Compression, much has changed.
One notable change is the college premium, or “the relative wage of college versus high-school educated workers.”44Acemoglu & Autor, supra note 3, at . The college premium had decreased during the 1940s before beginning to rise again in the 1950s, as noted above. Data following the college premium into the 2000s further reveals that the college premium dipped again during the 1970s. By the end of the 1970s, the premium was about where it had been in 1964. The college premium then began a consistent upward trajectory for the next several decades.45Id. at 7, fig. 1. By 2008, it had reached a “high water mark,” of sixty-eight log points, implying “that earnings of the average college graduate in 2008 exceeded those of the average high school graduate by 97 percent.”46Id. at 7.
The reversal of the college premium trend is largely attributable to a deceleration of relative supply, which has never entirely recovered. A confluence of factors caused this.47Id. at 8. The Vietnam War increased college attendance through the 1960s and 1970s artificially, as males could defer military service—and thus the draft—by enrolling. The comparatively larger Baby Boomer generation meant that enrollment was especially high, at a time when female enrollment also began to increase. When the war ended, however, enrollment dropped dramatically, particularly among males. The decreasing college premium in 1970s likely also contributed to this drop, as the drop in relative earnings likely rendered college less desirable.48Id. Recall the college premium is different from the return to college, so a drop in the college premium might very well mean that deferring working for several years and investing in additional education made less economic sense or was otherwise less feasible.
At the same time, changes were emerging in real wages across different education levels. Acemoglu and Autor first presented a breakdown of composition adjusted log weekly wages for full time, full year workers from 1963 through 2008, broken down into five education levels: (1) high school dropout (“HSD”); (2) high school graduate (“HSG”); (3) some college (“SMC”); (4) college graduate (“CLG”); and (5) greater than college (“GTC”).49Id. at figs. 4a & 4b. This graph reveals that the 1973 oil shock impacted all earners—with wage levels experiencing a quick drop, then stagnation, which they note was fairly consistent across genders and education groups. After the stagnation period, a period of increasing inequality across education groups began. This deviation was particularly striking among males, as shown in their graph reprinted below:
Figure 1:50Acemoglu & Autor, supra note 3, at fig. 4a (“Source: March CPS data for earnings years 1963-2008. . . . The real log wage for each education group is the weighted average of the relevant composition adjusted cells using a fixed set of weights equal to the average employment share of each group.”). Acemoglu and Autor also provide a graph for females, with the same breakdown through this period. While the early trends are the same, the disparity across education levels by the end of the sample is less pronounced among females, and all female educational levels saw real wage increases, albeit very modest ones for the lowest educational levels. Id. at fig. 4b.
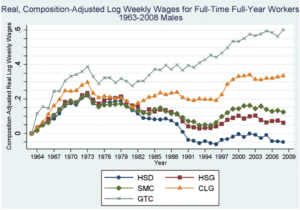
Acemoglu and Autor focus on three variables regarding earnings evolution that had not previously been uncovered. First, much of the increase in the “college premium” in recent decades in fact derives from increased compensation to the “greater than college” cohort, that is, those with graduate level work. Second, a “major proximate cause of the growing college/high school earnings gap is not steeply rising college wages but rapidly declining wages for the less educated—especially less educated males.”51Id. at 10. They note that it is possible this is somewhat misleading, given it presents only wages and not other compensation, some of which has increased over the period, such as healthcare and leave (like vacation, parental, and sick time); though they expect increases in other compensation are unlikely to entirely offset their findings.52Id. at 10–11. Third, the gaps between some college, high school graduate, and high school dropout workers grew in the 1980s but apparently stabilized thereafter.
Acemoglu and Autor also tracked the evolution of real log weekly wages for full time, full year workers at the 10th, 50th, and 90th percentiles of the income earnings distribution from 1963 to 2008. This presentation again reveals a drop and stagnation into the 1980s. While the 90th percentile begins increasing the distance between the 10th and 50th in the 1970s, the meaningful separation occurs in later periods (as the college premium likewise grows).
Figure 2:53Id. at fig. 7a (“Source: March CPS data for earnings years 1963-2008. For each year, the 10th, median and 90thpercentiles of log weekly wages are calculated for full-time, full-year workers.”).
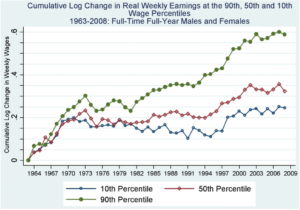
The Acemoglu and Autor work tracks and identifies the wage polarization occurring over the last several decades. Those with higher educational and income levels saw their real wages rise (and this rise occurred at a faster pace) while, at the same time, those with lower educational and income levels experienced real wage stagnation or even decreases.
A study by Song et al. tracks U.S. firms between 1978 and 2012, constructing a matched employer-employee data set, to demonstrate that “virtually all of the rise in earnings dispersion between workers is accounted for by increasing dispersion in average wages paid by the employers of these individuals.”54Jae Song, David J. Price, Faith Guvenen, Nicholas Bloom & Till von Wachter, Firming Up Inequality 1 (Nat’l Bureau of Econ. Rsch., Working Paper No. 21199, May 2015), https://perma.cc/C6ED-LV9W. This study finds “pay differences within employers have remained virtually unchanged, a finding that is robust across industries, geographical regions, and firm size groups.”55Id. The authors conclude that “this fact of stable inequality within firms should inform our understanding of the great increase in inequality within the United States over the last three decades.”56Id. at 30.
In addition to the increasing college premium and wage polarization, the literature also reveals “job polarization,” or “the simultaneous growth of the share of employment in high-skill, high-wage occupations and low-skill, low-wage occupations.”57Acemoglu & Autor, supra note 3, at 16 (emphasis omitted). This phenomenon has contributed to concerns about the declining middle class in America.58Id. at 68; see Juliana Menasce Horowitz, Ruth Igielnik & Rakesh Kochhar, Trends in Income and Wealth Inequality, Pew Rsch. Ctr. (Jan. 9, 2020), https://perma.cc/6PZ3-3VCM. Job polarization increasingly pushes workers toward either end of the education-wage spectrum, offering fewer options in the center space.59Acemoglu & Autor, supra note 3, at 22, 26. Note, the literature sometimes refers to “skill” level as, essentially, a proxy for education. This Article prefers to use the “education” level nomenclature, as this more accurately describes the phenomenon. For instance, a chef or artisan may be very highly skilled but not hold any college degrees. See id.
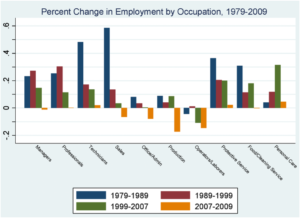
Acemoglu and Autor study this trend and present a graph depicting growth across ten broad occupation categories from 1979 to 2009.60Id. at fig. 12. They note that these ten occupational categories fit neatly into three groups. From left to right in the graph below, these are: First, highly educated, highly paid occupations, comprised of managers, professionals, and technicians. Between twenty-five and sixty percent of workers in these categories held at least a four-year college degree in 1979. Second, middle-educated, middle-paid occupations, comprised of sales, office and administrative support, production (including craft and repair), and operators and laborers (including fabricators). And third, service occupations, which the Census Bureau defines as jobs that entail helping or caring for others. Most workers in these categories have no post-secondary education and their hourly wages are lower than those of the other seven categories, on average.61Id. at 17–19, fig. 12.
Figure 13a demonstrates that occupations in the first and third categories saw growth across, essentially, the entire period studied. In fact, nearly all the decreases in employment are clustered within the occupations at the center of the graph—that is, the “middle” education/pay occupations. Most striking is the effect of the 2008 Recession, represented by the fourth bar in each of the four-bar clusters in the figure below. During this difficult economic period, the highly educated, highly paid occupations saw no absolute decline in employment. And the service occupations saw modestly positive employment growth (faring better than the highly educated, highly paid occupations). The middle-sector occupations were clearly the hardest hit: these occupations saw absolute declines in employment between seven and seventeen percent.62Id. at 18, figs. 12 & 13a.
Figure 3:63Id. at fig. 12 (“May/ORG CPA files for earnings years 1979-2009. The data include all persons ages 16-64 who reported having worked last year, excluding those employed by the military and in agricultural occupations. Occupations are first converted from their respective scheme into 326 occupation groups consistent over the given time period. All non-military, non-agriculture occupations are assigned to one of ten broad occupations presented in the figure.”).
Research to understand this phenomenon—why workers are being increasingly funneled away from traditionally middle-class roles—reveals the importance of the distinction between routine and nonroutine tasks in the modern economy.64Id. at 20–22. This research breaks occupations into categories based upon whether they are comprised mainly of cognitive or noncognitive and routine or nonroutine tasks. By and large, routine tasks (be it cognitive or noncognitive) dominate the middle-class jobs experiencing the largest employment declines. Meanwhile, the higher and lower end occupations tend to revolve around nonroutine cognitive or noncognitive tasks.
Two observations regarding how technological developments affect these occupations differently lead to the proposition that technology has a skill-bias effect in the modern economy, known as skill-biased technical change.65See, e.g., David H. Autor, Frank Levy & Richard J. Murnane, The Skill Content of Recent Technological Change: An Empirical Exploration, 118 Q.J. Econ.1279, 1279 (2003) (“A wealth of quantitative and case-study documents a striking correlation between the adoption of computer-based technologies and the increased use of college-educated labor within detailed industries, within firms, and across plants within industries. This robust correlation is frequently interpreted as evidence of skill-biased technical change.”); Giovanni L. Violante, Skill-Biased Technical Change, in The New Palgrave Dictionary of Economics 1–6 (Steven Durlauf & Lawrence Blume eds., Palgrave Macmillan 2d ed. 2008) (“Skill-biased Technical Change is a shift in the production technology that favors skilled over unskilled labor by increasing its relative productivity and, therefore, its relative demand.”); Colin Caines, Florian Hoffmann & Gueorgui Kambourov, Complex-Task Biased Technological Change and the Labor Market, 25 Rev. Econ. Dynamics 298 (2017). First, routine tasks—those which can (fairly) easily be broken down into a discrete set of repeating instructions—are more susceptible to substitution from technologies. Consider assembly lines or software programs (like Excel). Second, and relatedly, certain nonroutine cognitive tasks are complemented by technology. Consider legal research that previously required manually searching hard copies of legal precedent; advances to move case opinions to searchable digital databases have not necessarily made lawyers obsolete, but made them more efficient, and so more valuable.66Autor et al., supra note 65, at 1280 (“The simple observations that undergird our analysis are (1) that computer capital substitutes for workers in carrying out a limited and well-defined set of cognitive and manual activities, those that can be accomplished by following explicit rules (what we term ‘routine tasks’); and (2) that computer capital complements workers in carrying out problem-solving and complex communication activities (‘nonroutine’ tasks).”).
Moreover, as technology further supplements routine tasks, the importance of social skills in the workplace grows. Research demonstrates this characteristic has an impact distinct from skill level, and that workers are increasingly rewarded for demonstrating higher levels of social aptitude.67David J. Deming, The Growing Importance of Social Skills in the Labor Market, 132 Q.J. Econ. 1593, 1625 (2017) (“This shows that relatively higher returns to skill in social skill-intensive occupations are not simply a proxy for job complexity or overall skill requirements. . . . I find that the labor input of routine tasks has continued to decline, and that nonroutine analytical (math) task inputs stopped growing and even declined modestly after 2000. However, social skill task inputs grew by 24% from 1980 to 2012, compared to only about 11% for nonroutine analytical tasks. Moreover, while nonroutine analytical task inputs have declined since 2000, social skills task inputs held steady (growing by about 2%) through the 20000s. Not surprisingly, the decline in routine tasks mirrors the growing importance of social skills between 1980 and 2012.”). This has likewise affected the labor force, changing the composition of roles and the characteristics employers demand.68See John Maynard Keynes, Economic Possibilities for Our Grandchildren, in Essays in Persuasion (1932) (“We are being afflicted with a new disease of which some readers may not yet have heard the name, but of which they will hear a great deal in the years to come—namely, technological unemployment. This means unemployment due to our discovery of means of economising the use of labour outrunning the pace at which we can find new uses for labour. But this is only a temporary phase of maladjustment. All this means in the long run that mankind is solving its economic problem.”).
C. Top Income Earners
Much of the recent research and scholarship has focused upon fluctuations in the share of earnings going to top earners—particularly within the ninetieth and ninety-ninth percentiles.69See Piketty & Saez, supra note 29, at 11–12. Those at the very top of the income distribution have tended to have an outsized impact upon income distribution for as long as there is data tracking it. The data reveal insights regarding how top earnings shares have fluctuated over the decades, the kinds of events that have most impacted these shares, and who these top earners are.
Piketty and Saez’s influential 2003 article first compiled a homogenous series of shares of total income for upper fractiles covering most of the twentieth century.70Id. at 2. Their research demonstrates changes in both the shares going to the top decile of earners and the composition of income—each of which is relevant to the antitrust inquiry.
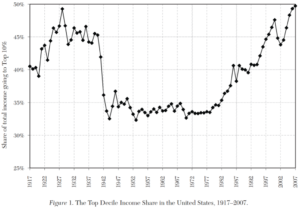
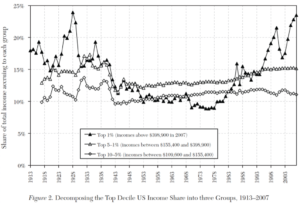
First, they measure how the share of income captured by the top decile has changed over time. As shown below in their Figure 1,71This graph updates Piketty and Saez’s original from the 2003 paper to include data through 2007. Atkinson et. al, supra note 9, at 6 fig. 1. the share hovered within the forty percent range for most of the 1920s and 1930s, before dropping precipitously in the early 1940s. The share then remained in the thirty percent range until the 1970s, when it began increasing again. Piketty and Saez note, in particular, that “the evidence suggests that the twentieth century decline in inequality took place in a very specific and brief time interval.”72Piketty & Saez, supra note 29, at 11. Similar to Goldin and Margo, they further posit that this “highly specific timing . . . strongly suggests that shocks to capital owners between 1914 and 1945 (depression and wars) played a key role” in the striking drop observed in the early period.73Id. at 12.
Figure 4:74Atkinson et al., supra note 9, at 6 fig. 1.
Piketty and Saez further break down the top decile into three components: the top 10–5% (P90–95), the top 5–1% (P95–99), and the top 1% (P99–100). This breakdown reveals that the top one percent “underwent enormous fluctuations over the twentieth century.”75Piketty & Saez, supra note 29, at 12. The top 0.01%, for instance, experienced “huge fluctuations”: from earning 400 times the average in 1915, down to 50 times the average in 1970, and back up 250 times the average by 1998.76Id.at 13. This breakdown suggests that the very top percentile of earners has an outsized impact. This revelation seems consistent with the TNEC Report’s early observation that examining smaller and higher fractions of earners among the top two percent showed more fluctuation with market events among the higher, smaller brackets.
Figure 5:77Atkinson et al., supra note 9, at 7 fig. 2.
Second, Piketty and Saez find the “income composition pattern has changed drastically between 1929 and 1998.”78Piketty & Saez, supra note 29, at 17. Earlier in the century, the top earners were “overwhelmingly rentiers deriving most of their income from wealth holdings (mainly in the form of dividends).”79Id. But by the end of the century, even the very top earners’ incomes derived in large part from wage and entrepreneurial income.80See id. at 15 tbl. III. Notably, they conclude the secular decline in capital is “entirely due to dividends.”81Id. at 19. Shares of interest, rent and royalties remained largely stable during the period examined, while the dividend share began around forty percent in the 1920s, and plummeted to less than ten percent by the 1990s.82Id.; see also Atkinson et al., supra note 9, at 7 fig. 2. This decline in capital income was critical to the reduction of top income shares before 1950.83Piketty & Saez, supra note 29, at 31. Those in the highest echelons were most sensitive to these capital reductions, as Figure 2 evidences.84See Atkinson et al, supra note 9, at 5 (“[T]he fall in the top percentile share is primarily a capital income phenomenon: top income shares fall because of a reduction in top wealth concentration.”).
As a result of these phenomena—increasing income share among top percentile earners in recent years, and an increasing portion of income derived from wages—top earners have been capturing a higher share of wage income in recent decades, as well. Piketty and Saez find that “wage inequality, measured by top fractile wage shares, starts to increase in the early 1970s.”85Piketty & Saez, supra note 29, at 31.
Wages continue to play a larger role in top incomes than it did prior to World War II. Indeed, a study by Bakija, Cole, and Heim demonstrates that salary and business income accounts for approximately 63% of the increase in the share of national income captured by the top 0.1% of earners between 1971–1980 and 2001–2010.86Jon Bakija, Adam Cole & Bradley T. Heim, Jobs and Income Growth of Top Earners and the Causes of Changing Income Inequality: Evidence from U.S. Tax Return Data 2–3 (Apr. 2012) (unpublished manuscript). These authors conclude that “theories to explain the rising top income shares . . . must largely be about compensation for labor.”87Id. at 3. The next subsection explores this notion further. Note, however, data also indicate that capital incomes have increased significantly for top earners in recent years.88See, e.g., Atkinson et al., supra note 9, at 53. Thus, it seems that capital incomes may also be intertwined in a particular way with recently observed trends.
Finally, the trends among the top earners continue to impact disparately those in the very highest percentiles. In recent years, the increases in income shares among top earners have been captured almost entirely by the top one percent, with modest or no gains flowing to the remaining nine percent.89See, e.g., id. at 7 fig. 2.
The literature also tracks the occupations comprising the top tier of earners. Here again, there are observed changes to which occupations command the top positions within this space. Before turning to a more comprehensive review of top income earners, it first might be interesting to trace the occupations of billionaires, alone, throughout the twentieth century. Delong’s analysis begins in the early 1900s, approximately the “peak of the relative frequency of billionaires.”90J. Bradford DeLong, Robber Barons: Honest Broker/Hoisted from 1998, Grasping Reality, (Jan. 1, 1998), https://perma.cc/R8X5-JTES. In 1900, most billionaires’ fortunes derived from railroads: of the twenty-two billionaires at the time, nine were related to railroad construction and operation, while five were related to finance, which at the time, “meant almost exclusively railroad finance.”91Id. By 1918, however, the industries producing billionaires had begun to diversify, and included photography, retail, chemicals, tobacco, farm equipment, automobiles, food processing, oil, and steel.
Into the mid–twentieth century, the number of billionaires grew more slowly, led primarily by aluminum and oil. From 1980 until nearly the close of the century, this growth has increased, adding new prominent categories. For the first time, a significant portion of billionaire fortunes were inherited, owing largely to the stock market boom at the end of the century. And a new “leading sector” DeLong describes as potentially comparable to the railroads of yore would combine electronics, software, entertainment, and telecommunications fortunes, accounting for a quarter or more of billionaires’ fortunes in 1996.92Id. This narrow focus upon the industries in which billionaires’ fortunes have been made in America over twentieth century demonstrates a developing basis of wealth, which mirrored the economy in many ways, in terms of both stock market movements and growing (or declining) industries.
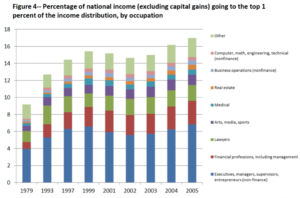
Occupations among the top income earners in the modern era, excluding capital gains, merit closer scrutiny.93The story is very similar when capital gains are included. Bakija et al., supra note 86, at 17–18, 35–36 tbls. 2 & 2a. Executives, managers, and supervisors in non-finance industries represented over 30% of taxpayers in the top one percent between 1979 and 2005, though this category decreased from 36% at the beginning of the period to 31% by the end. Notably, salaried executives within this category decreased from 21% at the start to about 11% at the end of this period.94Id. at 17–18, 35 tbl. 2. Bakija et. al note that this change, which coincides with an increase in executives of closely held businesses, is consistent with their observation that the Tax Reform Act of 1986 encouraged transitions from C-corporation to S-corporation status. Id. at 18. Financial professions (including management) nearly doubled their position within the top one percent, growing from under 8% to almost 14% during this period.95Id. at 18, 35 tbl. 2. Other occupations remained more stable over the period, including: medical (15.7% in 2005), lawyers (8.4% in 2005), computer, math, engineering, technical (non-finance) (4.6% in 2005), and real estate (3.2% in 2005).96Id. at 35 tbl. 2.
The role of executives, managers, and supervisors (non-finance) and financial professionals including management is even more outsized when honing in on the top 0.1% of the income distribution. Here, executives, managers, and supervisors (non-finance) accounted for just over 48% in 1979 and 42.5% in 2005.97Id. at 37 tbl. 3. Salaried, non-finance executives in the top 0.1% fell from 32% to 14% during this period. Id. Financial professions including management increased from 11% of the top 0.1% in 1979 to 18% in 2005.98Id. Meanwhile, the other occupations mentioned hold the following positions in the top 0.1% in 2005: medical (5.9%), lawyers (7.3%), computer, math, engineering, technical (non-finance) (2.9%), and real estate (3.7%).99Bakija et al., supra note 86, at 37 tbl. 3.
Thus, executives, managers, and supervisors (non-finance) and financial professionals including managers have played an important role in the top one percent over the last several decades. Notably, while the shares earners within the top one percent for each category moved in conflicting directions (decreasing versus increasing, respectively), both categories saw their share of national income captured by its members increase substantially over this period. For executives, managers, and supervisors (non-finance) in the top one percent, their share of national income rose from 3.7% in 1979 to 6.4% in 2005; and the share of national income going to financial professionals in the top one percent increased from 0.8 to 2.8% during this period.100Id. at 19–20, 41 tbl. 6. These increases were so marked, in fact, that Bakija, Cole and Haim estimate that “these two occupation groups alone explain a majority of the increase in the income share of the top 1%, explaining 60% of the increase between 1979 and 2005, and 61% of the increase between 1993 and 2005.”101Id. at 20.
The occupations comprising the top income earners is perhaps not surprising given the earlier discussion of labor market trends—away from routine tasks toward non-routine tasks requiring a higher social adeptness.
Figure 6:102Id. at 56 fig. 4.
Further examination of the dispersion of incomes reveals that inequality is increasing not only across occupations, but withinoccupations, as well.103See id. at 8 (“There is abundant evidence from the labor economics literature that increases in earnings inequality have been ‘fractal’ in nature – almost regardless of how you define a group, including by occupation, earnings inequality has been increasing within that group.”). Bakija, Cole, and Haim’s 2012 analysis, for example, reveals “a large amount of divergence in the incomes of people within the same profession,” and very different income growth rates across professions, even restricting consideration to the top one percent of income earners.104Id. at 23; see also id. at 22 (“The key lessons of these tables are: (1) real income growth was high in almost all top-earning professions in all three income groupings; (2) despite that, there was substantial heterogeneity in income growth rates across professions; (3) there is substantial heterogeneity across occupations in the apparent degree of sensitivity of income to the business cycle and asset prices; and (4) there was major divergence over time between the incomes of the highest paid people within each profession and others in that profession, even when we restrict our attention to people in the top one percent of the national income distribution.”). They posit that both these factors “suggest that the causes of rising top income shares cannot just, or even primarily, be things that are changing in similar ways over time for everyone within the top one percent, such as federal marginal income tax rates.”105Bakija et al., supra note 86, at 24. This argument, again, has important implications for the antitrust connection—which would seem to be a factor that changes in (at least fairly) similar ways across time and across top income earners.
A significant share of executive pay, today, derives from stock options—most of which are treated as wage and salary compensation on tax returns when exercised.106Id. at 3–4. It was not always the case that a large portion of executive compensation came in the form of stock options. Indeed, it was not until the second half of the twentieth century that stock compensation began to take its modern role in executive compensation.107See, e.g., Carola Frydman & Raven E. Saks, Historical Trends in Executive Compensation 1936-2003, at 2 (January 18, 2007), https://perma.cc/Y439-3GKW. (“[T]he use of executive stock options . . . have risen as a fraction of average compensation every decade from the 1950s to the present.”). The role of stock options, and its connection to alleged monopoly profits cycle, is another point of interest for the antitrust discussion later on.
D. Conclusions and Proposed Causes
The literature examining the trends discussed thus far leads to three conclusions.108Additional literature from recent years includes: Boas Bamberger, Christian Homburg & Dominik M. Wielgos, Wage Inequality: Its Impact on Customer Satisfaction and Firm Performance, 85 J. Mktg. 24 (2021); Daron Acemoglu & Pascual Restrepo, Robots and Jobs: Evidence from U.S. Labor Markets, 128 J. Pol. Econ. 2188 (2020); John M. Amis, Johanna Mair & Kamal A. Munir, The Organizational Reproduction of Inequality, 14 Acad. Mgmt. Annals 195 (2020); David Autor, David Dorn, Lawrence F. Katz, Christina Patterson & John Van Reenen, The Fall of the Labor Share and the Rise of Superstar Firms, 135 Q.J. Econ. 645 (2020); David H. Autor, Work of the Past, Work of the Future, 109 Am. Econ. Ass’n. Papers & Procs. 1 (2019); Anne S. Tsui, Georges Enderle & Kaifeng Jiang, Income Inequality in the United States: Reflections on the Role of Corporations, 43 Acad. Mgmt. Rev. 156 (2018); Thomas Piketty, Emmanuel Saez & Gabriel Zucman, Distributional National Accounts: Methods and Estimates for the United States, 133 Q.J. Econ. 553 (2018). First, the very top earners have had an outsized impact upon the distribution of income for as long as the data permits examination. Changes to the income shares being appropriated by the top 1%, even the top 0.1%, have tended to dictate whether the overall distribution is more or less skewed. Second, the composition of income has changed over the period observed: wage income is more important now than it was at the start of the period; while capital income began as an important indicator, it dropped following the Great Depression and World War II, before seeing a resurgence in recent years. Third, the trend of the very top earners increasing their share of the national income has continued to increase in recent decades, for so long as the data permits observation.
Simultaneously, there appears to have been a “carving out” of the traditionally middle-class occupations and wages. Thus, not only are the very top earners increasing their share; but the rest of the distribution is increasingly being funneled into either higher-education, higher-income jobs or lower-education, lower-income ones. This has led to polarization in both wages and jobs.
This literature also reveals potential explanations for the observed outcomes. For instance, unique factors present and following World War II are largely attributed with catalyzing the Great Compression, and with maintaining a more modest share of income being captured by the very top earners in the years that followed.109Frydman & Saks, supra note 107, at 16. These factors included governmental wartime policies, like the National War Labor Board (“NWLB”), and market forces, like the increased demand for (comparatively) lower-skilled manufacturing roles.110Id. at 23–28; see also Claudia Goldin & Lawrence F. Katz, The Returns to Skill in the United States Across the Twentieth Century, at 26 (Nat’l Bureau of Econ. Rsch., Working Paper No. 7126, 1999), https://perma.cc/8T5C-5K6M (“The two largest and most persistent periods of wage structure narrowing (the late 1910s and the 1940s) were also ones of world war, inflation, tight labor markets, strong demand for manual workers, rising union strength, and substantial government intervention in the labor market. Both episodes strongly suggest the importance of labor market institutions and the role of wars in the erosion of customary wage differentials.”). Moreover, the Great Compression tightened “both the upper and lower tails of the distribution.”111Goldin & Margo, supra note 14, at 32. The power of this time period in constricting inequality in income distribution derived not only from a significant dip in the share of income flowing to the top income earners, but also from a rising minimum wage which “continued to pull up the bottom of the wage distribution.”112Id. This fact bears important policy implications for current attempts to equalize income distribution.
Scholars have explored the evolution of U.S. tax policy since the Great Depression or World War II eras to the present. This work consistently finds that tax policy does, in fact, play a role in the distribution of incomes, particularly of the very top earners.113See, e.g., Thomas Piketty, Emmanuel Saez & Stefanie Stantcheva, Optimal Taxation of Top Labor Incomes: A Tale of Three Elasticities, 6 Am. Econ. J.: Econ. Pol’y 230, 246 fig. 1 (2014); Piketty & Saez, supra note 29, at 24 (“We are not the first to propose progressive taxation as an explanation for the decrease in top shares of income and wealth. Lampman [1962] did as well, and Kuznets [1955] explicitly mentioned this mechanism as well as the shocks incurred by capital owners during the 1913 to 1948 period, before presenting his inverted U-shaped curve theory based on technological change.”); see also Frydman & Saks, supra note 107, at 2 (“The widespread adoption of restricted stock options directly after the passage of the 1950 Revenue Act suggests that compensation arrangements were highly responsive to tax policy.”). Indeed, work examining income distribution over the twentieth century predicted that “the decline in income tax progressivity since the 1980s . . . might again produce in a few decades levels of wealth concentration similar to those at the beginning of the century.”114Piketty & Saez, supra note 29, at 24. While tax policy, and income tax policy in particular, is not a complete explanatory factor, it does appear to be a powerful one.115Id. at 14 (“[T]he pattern of top income shares cannot be explained fully by the pattern of top income tax rates.”).
Additional factors frequently cited as contributing to trends in income distribution, especially relating to job and wage polarization, include skill-biased technical change, and globalization and offshoring.116See generally Autor et al., supra note 11, at 1338; David H. Autor, David Dorn & Gordon H. Hanson, The China Syndrome: Local Labor Market Effects of Import Competition in the United States, 103 Am. Econ. Rev. 2121 (2013) (“In our main specification, import competition explains one-quarter of the contemporaneous aggregate decline in US manufacturing employment.”). Still other work identifies a “particularly important role for financial market asset prices, shifting of income between the corporate and personal tax bases, and possibly corporate governance and entrepreneurship, in explaining the dramatic rise in top income shares.”117Bakija et al., supra note 86, at 27; see also Frydman & Saks, supra note 107, at 3 (“Thus, a number of other factors also have influenced changes in the compensation arrangements of top officers over time. Among other explanations, corporate governance, social norms, the market for corporate control, and the labor market for executives, may have contributed to the evolution of executive compensation.”). Bakija et al. also discuss the importance of the Tax Reform Act of 1986, which reduced the top personal tax rate below the top corporate rate. They note that this “created an incentive to change one’s business to a pass-through-entity such as an S-corporation, the income of which is taxed only once at the personal level. This has important implications for the income inequality and taxable income elasticity literatures, because it suggests that part of the difference in top incomes before and after 1986 does not reflect the creation of new income, but rather income that was previously not reported in the data (which is derived from personal income tax returns) and now is.” Bakija et al., supra note 86, at 9. Though they note that income shares going to the top 0.1% continue to increase even restricting review to later periods. As Goldin and Katz explain, wage structure and its compression last century “was larger in magnitude, more drawn out in time, and more complicated in its reasons than has previously been thought. Similarly, the widening of the wage structure and the increase in the returns to education in the post–1970s period . . . have been shown to be abundantly complex.”118Goldin & Katz, supra note 110, at 27.
While many culprits have been identified in this literature, one conspicuously absent from rigorous review (so far) is antitrustlaw and policy. The corpus of work empirically examining the income distribution trends largely omits discussion of this particular suspect.119Piketty & Saez, supra note 29, at 24 n.28 (DeLong “points out the potential role of antitrust law,” but does not further investigate this theory). Some work discusses more broadly the roles of regulation (or deregulation), labor market institutions (including unions), as well as societal pressures to constrain excess, particularly in times of economic hardship, which places downward pressure on the highest wages—pressure which seems to have dissipated from previous peaks around the World Wars and the Great Depression.120See, e.g., Piketty & Saez, supra note 29, at 34 (“We think that this pattern of evolution of inequality is additional indirect evidence that nonmarket mechanisms such as labor market institutions and social norms regarding inequality may play a role in the setting of compensation at the top. The Great Depression and World War II have without doubt had a profound effect on labor market institutions and more generally on social norms regarding inequality.”);Stiglitz, supra note 8, at 198–99 (discussing deregulation and inequality). But none of this work (yet) grapples directly and meaningfully with the role of antitrust law and enforcement, specifically.
II. Antitrust Trends
There is a simple, but popularly persuasive, story that critics of modern antitrust offer regarding antitrust and income inequality: income inequality has skyrocketed since the 1980s, following the Court’s formal adoption of the consumer welfare standard; this standard weakened antitrust enforcement and, in doing so, contributed to the rising inequality trend observed since. The next Section more closely analyzes this argument and the means by which modern antitrust policy is alleged to facilitate income inequality growth. Understanding the history of antitrust law and policy both before and after the 1980s creates a fuller picture upon which to base a comparison of the two phenomena.
A. Adoption of the Sherman Act and Early Enforcement Efforts
In 1890, Congress passed the inaugural federal antitrust legislation, the Sherman Act, laying the foundation for the United States’ federal antitrust regime.121Sherman Antitrust Act of 1890, 15 U.S.C. §§ 1–7. The Sherman Act’s broad language proscribes “[e]very contract, combination . . . or conspiracy[] in restraint of trade,” as well as monopolization, attempted monopolization, and conspiracies to monopolize.122Id. Its sweeping mandates left significant work for the courts in deciphering and rendering workable the Act’s prohibitions.123See, e.g., Elyse Dorsey, Antitrust in Retrograde: The Consumer Welfare Standard, Socio-Political Goals, and the Future of Enforcement, in The Global Antitrust Institute Report on the Digital Economy 109, 115–16 (Joshua D. Wright & Douglas H. Ginsburg eds., 2020 ed.).
As courts struggled for the first several decades in this herculean task, many scoured the legislative history of the Act for any valuable insights that might be gleaned.124See, e.g., Temp. Nat’l Econ. Comm., 76th Cong., Investigation of Concentration of Economic Power, Monograph No. 16, Antitrust in Action 10 (Comm. Print 1940) [hereinafter TNEC Antitrust in Action] (“A great deal has been said about the purpose of Congress in passing the act.”); see also Douglas H. Ginsburg, Bork’s “Legislative Intent” and the Courts, 79 Antitrust L.J. 941 (2014) (identifying numerous interpretations proferred). The task continues to this day, with any agreement or final resolution continuing to evade discovery. Despite the apparent futility of this effort, some scholars today continue to rely upon legislative history to argue that antitrust should further not only economic goals, but socio-political ones, as well.125See, e.g., Lina Khan & Sandeep Vaheesan, Market Power and Inequality: The Antitrust Counterrevolution and Its Discontents, 11 Harv. L. & Pol’y Rev. 235, 270, 277–79 (2017) (“The congressmen and senators involved in the debates preceding the passage of the principal antitrust laws voiced a number of concerns, including the protection of consumers and suppliers from firms with market power, the defense of small businesses from the predatory tactics of large rivals, and the preservation of democracy. Efficiency was not on Congress’s radar in 1890 or 1914.”); Sandeep Vaheesan, The Profound Nonsense of Consumer Welfare Antitrust, 64 Antitrust Bull. 479, 480 (2019) (“The drafters of these landmark statutes sought to restrict corporate power over consumers, workers, suppliers, and rivals.”). Others contend that Congress’s intent in passing the Act was to promote economic efficiency or consumer welfare alone.126See, e.g., Robert H. Bork, The Antitrust Paradox 61–66 (1978) (“The legislative history of the Sherman Act, the oldest and most basic of the antitrust statutes, displays the clear and exclusive policy intention of promoting consumer welfare.”); Robert H. Lande, Wealth Transfers as the Original and Primary Concern of Antitrust: The Efficiency Interpretation Challenged, 34 Hastings L.J. 65, 68 (1982) (“Congress passed the antitrust laws to further economic objectives, but primarily objectives of a distributive rather than of an efficiency nature.”). Still others identify protecting special interest groups representing small businesses as the true driving force behind the Act’s passage—this type of rent-seeking behavior by interested stakeholders is an important undercurrent coursing through antitrust history, which will be examined further below.127See, e.g., Herbert Hovenkamp, Enterprise and American Law, 1836-1937, at 246–47 (1991) (“[T]here is equally good evidence that Congress’s rhetoric does not fully account for its true motives, which were to protect various special interest groups representing small business. For example, Senator John Sherman himself may have been the cat’s-paw of the independent oil producers and refiners, who wanted protection from both Standard Oil Company and the railroads. Among the most aggressive lobbying organizations were several associations of salesmen and independent distributors, whose positions in the American economy were threatened by larger, vertically integrated firms.”); Thomas J. DiLorenzo, The Origins of Antitrust: Rhetoric vs. Reality, 13 Regul. 26, 27 (1990) (“[T]he Sherman Act was never intended to protect competition. It was a blatantly protectionist act designed to shield smaller and less efficient businesses from their larger competitors.”). And others yet observe that the legislative history has been meticulously combed, to little avail, and that today’s efforts and discussions should focus instead upon the lived experiences of applying the Act over the last 130 years.128See, e.g., TNEC Antitrust in Action, supra note 124, at 10–11 (“In a search for intent the record has been thumbed through with meticulous care and to little purpose.”); Dorsey, supra note 123, at 114 (“Perhaps more important—and certainly more informative—than the intent of the 1890 (and later) congressmen and language that, by definition, did not make it into the statutes, is the courts’ practical history of enforcing the laws as enacted.”).
Throughout the twentieth century, the Sherman Act’s primary provisions—sections 1 and 2—remained largely unchanged. Some have argued that “[o]ne of the most significant changes in antitrust enforcement of the Gilded Age” derived not from “new legislation, but from a change in the approach taken to the enforcement of existing law when [Theodore] Roosevelt became president” suddenly in 1901 after President McKinley’s assassination.129Richard B. Baker, Carola Frydman & Eric Hilt, Political Discretion and Antitrust Policy: Evidence from the Assassination of President McKinley 4 (Nat’l Bureau Econ. Rsch., Working Paper No. 25,237, 2018), https://perma.cc/PPP4-D4BQ; see also Thomas Philippon, The Great Reversal: How America Gave Up on Free Markets 160 (2019). Nonetheless, additional legislation was subsequently adopted, which contributed to the developing regulatory landscape. Notably, in 1914, Congress passed the Clayton Act,13015 U.S.C. §§ 12–27 (as amended). primarily addressing mergers,131Sections 3, addressing exclusive dealing, and 8, addressing interlocking directorates and officers, were also important additions. and the Federal Trade Commission Act,13215 U.S.C. §§ 41–58 (as amended). establishing the Commission (or the FTC), its jurisdiction, and other legal authorities. Congress passed the Robinson-Patman Act in 1936, outlawing certain price discrimination in the sale of commodity products.13315 U.S.C. § 13. The Celler-Kefauver Act of 1950 closed a loophole in existing legislation, prohibiting asset purchases (not just stock), and further intended to both permit challenges to vertical mergers and strengthen horizontal merger enforcement.134Celler-Kefauver Act, Pub. L. No. 81-899 (1950). In 1976, Congress passed the Hart-Scott-Rodino Antitrust Improvements Act,13515 U.S.C. § 18a. promulgating the modern pre-merger notification system which prevents parties from consummating certain mergers without first notifying the Federal Trade Commission (“FTC”) and U.S. Department of Justice (“DOJ”) and allowing for statutorily prescribed review process.
Early antitrust decisions reflect the difficulty of conceptualizing the Sherman Act’s broad mandates and identifying a consistent, coherent set of priorities. For instance, the courts issued decisions finding that the Act should protect “small dealers and worthy men,”136United States v. Trans-Missouri Freight Ass’n, 166 U.S. 290, 323–24 (1897). and “put an end to great aggregations of capital because of the helplessness of the individual before them.”137United States v. Aluminum Co. of Am., 148 F.2d 416, 428 (2d Cir. 1945). But these decisions simultaneously acknowledged that higher prices to consumers—perhaps the most individualistic group—might result from the positions taken, without delving into why these worthy individuals should be imposed upon.138See, e.g., Utah Pie Co. v. Cont’l Baking Co., 386 U.S. 685, 703 (1967) (reversing a ruling that would have facilitated lower prices); Brown Shoe Co. v. United States, 370 U.S. 294, 344 (1962) (explaining “higher costs and prices might result”); Trans-Missouri Freight Ass’n, 166 U.S. at 323–24 (finding a “[m]ere reduction in the price of the commodity dealt” was not a sufficient consideration). Other court decisions similarly displayed convoluted analysis, such as in United States v. Aluminum Company of America,139148 F.2d 416 (2d Cir. 1945). where the Court of Appeals for the Second Circuit specifically found that the “successful competitor, having been urged to compete, cannot be turned upon when he wins,” but then condemned the defendant expanding its capacity to meet consumer demand.140Id. at 430; see also United States v. U.S. Steel Corp., 251 U.S. 417, 451 (1920) (“The Corporation is undoubtedly of impressive size and it takes an effort of resolution not to be affected by it or to exaggerate its influence. But we must adhere to the law and the law does not make mere size an offence or the existence of unexerted power an offence. It, we repeat, requires overt acts and trusts to its prohibition of them and its power to repress or punish them. It does not compel competition, nor require all that is possible.”); United States v. Grinnell Corp., 384 U.S. 563, 570–71 (1966). In United States v. Topco Associates, Inc.,141405 U.S. 596 (1972). the Supreme Court condemned a joint venture of small and mid-sized regional supermarket operators which allowed the members to offer private label products they could not offer on their own, and which positioned them to better compete with the larger chains while lowering prices to consumers.142Id. at 608–11.
As Professor Hovenkamp notes, within the first seven years of its existence, lower courts found labor unions to have violated the Sherman Act in a dozen cases.143Hovenkamp, supra note 127, at 229 (“[A]lthough economists and many statesmen had substantial doubts about the effectiveness of the Sherman Act against industrial combinations and trusts, from the start the new statute was perceived to be a powerful union-busting device.”). This seems difficult to reconcile with an intent to protect “small dealers and worthy men.”144United States v. Trans-Missouri Freight Ass’n, 166 U.S. 290, 323–24 (1897). Congressmen, in fact, debated the proper statutory treatment of unions and organized labor—as they did many other concerns—while they considered the draft legislation. Senator John Sherman proposed an amendment, which was adopted by a Senate voice vote but later struck out (along with several other amendments) by the Judiciary Committee.145Hovenkamp, supra note 127, at 229. Yet again, there is not complete agreement as to the implications of the considered and rejected labor amendment to the original statute.146See id. at 229 (citing 21 Cong. Rec. 2611-2612, 2728-2731 (1890); Alpheus T. Mason, Organized Labor and the Law 122–27 (1925); Joseph A. Joyce, A Treatise on Monopolies and Unlawful Combinations or Restraints 175 (1911); James A. Emery, Labor Organizations and the Sherman Law, 20 J. Pol. Econ. 599, 604–06 (1912); Edward Berman, Labor and the Sherman Act 11–51 (1930)).
Antitrust decisions were, early on, typically marked by formalistic thinking and deep skepticism of novel conduct. The courts frequently, and often summarily, condemned mergers between firms with very small market shares and nearly all vertical arrangements.147See, e.g., United States v. Von’s Grocery Co., 384 U.S. 270, 278–79 (1966); United States v. Phila. Nat’l Bank, 374 U.S. 321, 323–24 (1963); Brown Shoe Co. v. United States, 370 U.S. 294, 346 (1962); Herbert Hovenkamp, Progressive Antitrust, 2018 U. Ill. L. Rev. 71, 84 (2018) (“Antitrust policy from the New Deal through the early 1970s became an economically irrational war on vertical integration of all types.”). These decisions earned antitrust enforcement in the mid–twentieth century the title of the “inhospitality tradition.”148See Elyse Dorsey, Anything You Can Do, I Can Do Better—Except in Big Tech?: Antitrust’s New Inhospitality Tradition, 68 Kan. L. Rev. 975, 979–85 (2020).
B. Mid–Twentieth Century: The Antitrust Revolution
Antitrust was at an inflection point by the mid–twentieth century. Criticisms of its numerous failures, inconsistencies, and incoherencies resounded widely and loudly. Antitrust courts would soon chart a clearer path, the development of which was decades in the making.
By many accounts, antitrust law in the mid–twentieth century was in crisis.149See, e.g., Bork, supra note 126, at 3–11. Tension had been building almost since the inception of the Sherman Act. By 1932, President Franklin D. Roosevelt’s chief antitrust advisor Milton Handler decried the entirety of Supreme Court antitrust jurisprudence as “singularly free of enlightenment,” noting that “[c]onflicting theories, divergent explanations of the facts and opposing contentions form an impenetrable jungle of words,” and concluding that to “reconcile the rationes decidendi of the opinions is an impossibility.”150Milton Handler, Industrial Mergers and the Anti-Trust Laws, 32 Colum. L. Rev. 179, 182–83 (1932). Justice Potter Stewart, reviewing this corpus of caselaw some three decades later came to largely the same conclusion, criticizing that the “sole consistency that I can find is that in litigation under § 7, the Government always wins.”151Von’s Grocery Co., 384 U.S. at 301 (Stewart, J., dissenting).
The criticisms of antitrust were relentless, and struck at the core of the doctrine. These criticisms called into question what antitrust law truly sought to accomplish, as well as its capacity to do so. A vigorous debate marshaling esteemed experts of many various viewpoints followed, ultimately ushering antitrust into the modern age.
Recently, however, some commentators have argued that the mid-twentieth century, from about the 1940s to the end of the 1970s, represents a “golden era of antitrust action.”152Maurice E. Stucke & Ariel Ezrachi, The Rise, Fall, and Rebirth of the U.S. Antitrust Movement, Harv. Bus. Rev. (Dec. 15, 2017) https://perma.cc/5SYB-5LMX; see also The Consumer Welfare Standard in Antitrust: Outdated or a Harbor in a Sea of Doubt: Hearing Before the Subcomm. on Antitrust, Competition & Consumer Rights of the S. Comm. on the Judiciary, 115th Cong. 8 (2017) (statement of Barry C. Lynn, Executive Director, Open Markets Institute), https://perma.cc/8B88-TL7Z (“This philosophy and practice of antimonopoly proved to be a phenomenal political and economic success. Through the heart of the 20th Century, America was at one and the same time the most free, the most prosperous, and the most powerful nation on earth.”). These proponents paint a rosy picture of antitrust law and policy during this time, arguing that it directly and meaningfully contributed to the lower levels of income inequality observed during this period.153Matt Stoller, The Return of Monopoly, The New Republic (July 12, 2017), https://perma.cc/MTJ7-B2D4. (“The anti-monopoly principle that [Thurman] Arnold and [Justice] Brandeis established—the idea that economic power should be decentralized and spread into many hands—became the basis of a new social contract. . . . America entered a golden age of egalitarian prosperity . . . .”); Anti-Monopoly Basics: Democracy & Monopoly, Open Mkts. Inst., https://perma.cc/B39U-YWWB(“This anti-monopoly system [from the 1930s to the 1980s] had a profound effect on the American economy and, crucially, on American democracy.”); see also Dorsey, supra note 123, at 141–43 (discussing these arguments).
The dichotomy between these two characterizations of antitrust law in the mid-twentieth century recalls Charles Dickens’s infamous opening to his novel, A Tale of Two Cities. Reading the antitrust literature and commentary, one might well conclude the that it was, indeed, “the best of times, it was the worst of times, it was the age of wisdom, it was the age of foolishness.” Dickens could have been describing those commentators of mid-twentieth century antitrust law when he penned, “in short, the period was so far like the present period, that some of its noisiest authorities insisted on its being received, for good or for evil, in the superlative degree of comparison only.”154Charles Dickens, A Tale of Two Cities 1 (1859).
Ascertaining the impact of antitrust enforcement across the economy—not merely within a given market—is a complex endeavor. There are many metrics by which one might begin to measure enforcement, such as the number of federal lawsuits filed, the number of investigations initiated, or the number of settlements achieved; there are also other metrics impacting the enforcement atmosphere, such as business review letters (in the case of the DOJ), guidance documents, warning letters, et cetera. There is also the critical question of how those efforts might be affecting choices market participants make.
To begin with this first part—analyzing enforcement trends—Judge Richard Posner conducted a statistical study of antitrust enforcement, from the inception of the Sherman Act through the 1960s. Again, there are many ways to examine the data, each with their own complications and limitations. One of the more complete data sets, and thus perhaps more illuminative, is the number lawsuits initiated by the DOJ and the FTC. The DOJ has had jurisdiction to enforce the antitrust laws since congress adopted the Sherman Act in 1890, while the FTC was established in 1915. The graph below shows the number of DOJ-initiated antitrust lawsuits, and of FTC-initiated restraint of trade cases, from 1890 through 1969:
Figure 7:155Richard A. Posner, A Statistical Study of Antitrust Enforcement, 13 J.L. & Econ. 365, 366–69, 366 tbl.1, 369 tbl.2 (1970) (the DOJ information was drawn from the “Bluebook” the Commerce Clearing House published, which lists all antitrust cases by filing date. FTC information was drawn from the “FTC Docket of Complaints,” which similarly includes brief summaries of cases by filing date; Posner limited Table 2 to FTC restraint of trade cases, excluding deceptive practices cases, cases involving “in essence a private business tort (such as commercial bribery),” and Robinson-Patman cases).
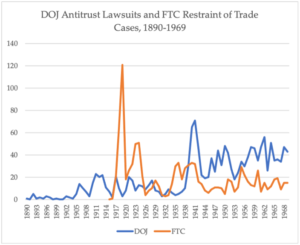
This chart squares with the notion that there was more antitrust enforcement, defined as the number of lawsuits filed by the antitrust agencies, in the later decades of the twentieth century than the earlier ones. Additional data indicate the number of private antitrust suits also was increasing over this time period, but the data on private enforcement are less complete.156Posner notes that the Administrative Office of the United States Courts began recording the number of private antitrust cases filed each year in 1938; but prior to that, there was no comprehensive collection of this data, making early years especially difficult to track. Id. at 370–71. While private plaintiffs’ filing rates hewed closely to the DOJ’s until about 1940, thereafter the number of private suits filed grows rapidly while the number of DOJ suits grows far more modestly. Note, additionally, that the FTC’s number of initiated cases begins rather high, then drops in the mid-1920s to mid-1930s, before seeing another uptick in the mid-1930s to early 1940s. The FTC’s individual data do not demonstrate an increase over time; in fact, the FTC initiated significantly more cases (620) before 1940 than in the following thirty years (444) from 1940 to 1969.157Id. at 369 tbl.2, 370.
The DOJ data, meanwhile, exhibits a significant increase in the early 1940s, followed by lower numbers in the subsequent decades, while maintaining a higher average than pre-1940. The high number of filings in the early 1940s is interesting because it coincides with World War II; one might suspect that antitrust enforcement would not be a top priority at this time, but the data reveal strong lawsuit filing numbers nonetheless. It is also interesting because these filings coincide with the income inequality drop observed at this time. If one believes that more antitrust enforcement helps to reduce inequality, that is precisely the inverse correlation one would expect to see. This observation is, however, more complicated than just these two graphs reveal; and its implications are explored further below in subsection 3.
The disparity of trends across plaintiffs—DOJ versus FTC versus private parties—raises another question regarding how to consider antitrust enforcement and what efforts are most productive towards the ends desired. Into the mid-twentieth century, as it appears the DOJ modestly increased the number of cases filed, the FTC continued filing about the same number of cases (or fewer), while private plaintiffs filed substantially more lawsuits in the later periods. Disentangling questions of whose enforcement efforts tend to drive the law’s effectiveness from those regarding substantive legal developments is difficult.
Rent seeking behavior plays a very particular role in the antitrust space. Antitrust laws have a history of struggling mightily against this kind of corruption, as research has well-documented.158Ryan Young, Antitrust Basics: Corruption and Rent-Seeking, Competitive enter. inst. (Aug. 21, 2019), https://perma.cc/2SFG-RNB2. Generally speaking, cases brought by the DOJ and FTC may be more desirable than those brought by private parties, assuming the agencies are in fact seeking to achieve their explicit goal of protecting American consumers. Moreover, lawsuits are only one avenue for enforcing antitrust goals, and fail to cover the entire corpus of the agencies’ work. So, these numbers provide just a snapshot, not the full picture.
Judge Posner explores alternative hypotheses to explain the variations in antitrust activity during this period. For instance, he considers whether the change in enforcement level (again, defined as number of cases filed) may reflect overall economic activity. He is skeptical of this hypothesis, however, because while he finds a “fair correlation between changes in antitrust and in overall economic activity until about 1940,” after that time the number of cases brought by the DOJ (and the FTC) do not increase significantly, despite “tremendous growth” in the economy.159Posner, supra note 155, at 367–68, 370, 368 fig.I. He also concludes the data do not support the hypotheses that antitrust increases in periods of contraction or war.160Id. at 367–68.
Another means of considering whether the overall environment is conducive to more or less antitrust enforcement is to consider how often antitrust plaintiffs win in court. There are, of course, many and varied other reasons why win percentages might change over time. But as a first approximation, it might be helpful to consider how the DOJ and FTC fared before the Supreme Court into the mid-twentieth century:
Figure 8:161Id. at 383–84, 384 tbl.14.
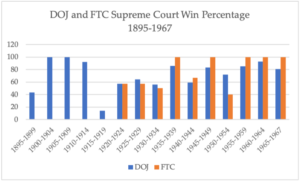
As Judge Posner notes, no clear trends emerge from these data, and attempts to interpret the data lead to rather ambiguous results. The antitrust agencies have fairly high win percentages across the period, with some variation. But the DOJ saw its highest win rates in the 1900–1914 periods, well before the alleged golden age of antitrust began. Considering this dataset, the 1940 to 1960 period displays no clear trend or distinctive features setting it meaningfully apart. The next subsection examines these data for more recent years.
C. Modern Antitrust Enforcement
Modern antitrust law is guided by the consumer welfare standard. This standard was embraced fully by the courts and the antitrust agencies after the inflection point within antitrust law in the mid-twentieth century. It is an economic standard that facilitates the decisionmakers’ analysis of whether the conduct before them is, or is not, unlawful. It recognizes that competition’s true power is in its ability to increase the “size of pie”—that competition does not merely serve to divide up existing societal welfare, but instead drives the creation of additional welfare. The “consumer” in the consumer welfare standard is broadly defined and need not be the end consumer or individual citizen. Indeed, many of the cases the agencies bring today allege harms to “business” as consumers.162See, e.g., FTC v. Staples, Inc., 190 F. Supp. 3d 100, 127 (D.D.C. 2016) (defining the relevant market as “consumable office supplies (a cluster market) sold and distributed by Defendants to large B-to-B [business-to-business] customers (a targeted market)”); United States v. Bazaarvoice, Inc., No. 13–cv–00133, 2014 WL 203966, at *22 (N.D. Cal. Jan. 8, 2014) (defining the relevant market as “R&R [ratings and reviews] platforms sold in the United States for retailers and manufacturers”).
A bedrock principle of U.S. antitrust law is that monopoly is not—nor has it ever been—unlawful per se.163Senator Sherman himself recognized that a large firm or an increase in concentration was not, of its own, unlawful. United States v. Topco Assocs., Inc., 405 U.S. 596, 620–21 (1972) (Burger, C.J., dissenting) (quoting 21 Cong. Rec. 2457, 2460); see also Dorsey, supranote 123, at 115 n.15 (quoting Burger, C.J.). Quite to the contrary, it has long been recognized that the possibility of monopoly profits, for at least a short time, is a critical incentive driving firms to compete; that absent this possibility, the benefits of competition are diminished and, along with them, the drive to compete vigorously. Thus, it is only the acts of firm with monopoly power that harm consumers and competition that are unlawful, rather the fact of the monopoly power, alone.
The consumer welfare standard helped the courts and agencies to operationalize the antitrust regime in a coherent and consistent way. Incoherent and inconsistent outcomes, in addition to rent seeking behavior, plagued early enforcement and undermined the rule of law in early decisions. Rent seeking behavior is also argued to play a rather significant role in increasing inequality. Within antitrust, rent seeking has a very particular history that would be ignored at the peril of efforts to mitigate, and not exacerbate, inequality.
Many critics of modern antitrust argue that it is enforced less often and less effectively than prior to about 1980.164SeeMelamed, supra note 5, at 269, 274–75. As noted, identifying which data can evaluate this claim is not necessarily obvious. The stringency of an antitrust regime is determined by a confluence of factors. And there may be many reasons why, for instance, the number of lawsuits filed may fluctuate, which could cut in either direction. Stronger enforcement effectively could have chilled unlawful behavior, or it could be that a focus on different kinds of cases or theories could be more effective and so fewer overall cases or theories are required to reach the same level of “strength” of regime. But an obvious starting point is that the modern antitrust regime began at about 1980, with the full adoption of the consumer welfare standard.165Id. at 271–72.
The DOJ Antitrust Division (the “Division”) has published Workload Statistics reports for each decade beginning in 1970 through 2019.166Division Operations, U.S. Dep’t of Just., Antitrust Div., (Nov. 16, 2021) https://perma.cc/ND8Z-NEVF. These reports contain discrete information regarding investigations, cases, business review letters, and other information relating to the Division’s efforts and court filings. Updating Judge Posner’s data regarding DOJ-initiated antitrust lawsuits, as well as with the Division’s win rates in the Appellate and Supreme Courts allows for a more complete record.
In his case count, Judge Posner relied upon the Commerce Clearing House’s “Bluebook,” which separately reported every antitrust complaint, indictment, and information. Judge Posner, however, collapsed several of those into what he considered to be a single proceeding, so as to avoid double or triple counting the same matter.167Posner, supra note 155 at 366–67 (“Although the Bluebook number of the last case filed by the Department in 1969 is 2081, the reader will note in Table 1 that the sum of cases through 1969 was only 1551. The reason for this discrepancy is that, with trivial exceptions, every antitrust complaint, indictment, and information is assigned a separate Bluebook number when it is filed, with the result that frequently what I consider a single proceeding is counted two or more times.”). The graph below contains “Total Civil Cases–Filed” with case counts from the District Court Antitrust Cases section of the Workload Statistics reports. Since it is unclear whether Judge Posner’s counting methodology perfectly matches the Workload Statistics’ methodology, the graph below presents only the Workload Statistics’ data168The number of cases filed appear similar enough in the close-in-time years that the count methodologies are likely very similar, but perhaps not identical.:
Figure 9:
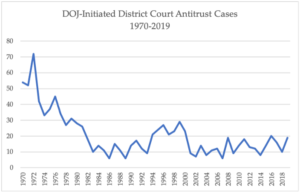
This graph demonstrates that the number of DOJ-initiated cases declined from the 1970s into the early 1980s. Since then, it has fluctuated somewhat—with the second peak in the mid to late 1990s—but has remained largely stable, between roughly ten to twenty cases each year.
The Workload Statistics reports further provide data on the Division’s win rate in the appellate courts and the Supreme Court:
Figure 10:169This computation counts cases marked as “won” versus “lost,” omitting “dismissed” (which appears in some Division Workload Statistics reports but not all). Note also that beginning in FY15 the Workload Statistics separately reported Supreme Court Cert Petitions and Merits Cases; the graph above collapses the two for consistency.
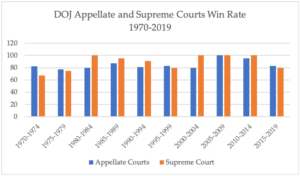
This data show that since 1980, the DOJ’s win rate in both the appellate courts and the Supreme Court was never below 80%. Recall the DOJ’s Supreme Court win rate from 1890 to 1969 saw a higher variance in earlier periods, ranging from 14% in 1915–1919 to 100% in 1900–1909.170Posner supra note 155, at 384 tbl.14. It has performed consistently better during the (roughly) second half of its time enforcing the Sherman Act. The DOJ’s Supreme Court win rate has hovered at or near 100% since the turn of the twenty-first century. In fact, the Division lost only one case at the Supreme Court level between 2000 and 2019.
The data further demonstrate that the Division has also commanded a high appellate court win rate over the last half century. Through the entire period, the DOJ’s appellate win rate was below 80% in only one five-year period, 1975-1979, when it was 77%.
These data reveal that while the DOJ filed fewer district court cases in recent periods, it also performed better in the Supreme Court in these periods; additionally, they show the DOJ has performed well in the appellate courts during these later periods. Implications for the overall level of antitrust enforcement based upon this particular data are, accordingly, somewhat difficult to draw. Perhaps the Division needs to bring fewer cases today because its consistently high success rates have had a chilling effect on harmful conduct and contributed to the growth of settlement rates; or perhaps the Division is overly cautious on filing cases, explaining its high win rate but omitting much other harmful behavior.
Information regarding modern FTC competition filings is less readily available than on the DOJ side. The FTC’s website does, however, provide a Competition Enforcement Database page, which provides information on yearly filings from 1996 through 2020.171See Competition Enforcement Database, Fed. Trade Comm’n, https://perma.cc/95T5-BSPC. The graph below shows the total reported number of matters for merger and nonmerger actions, as well as they total number of all competition actions:
Figure 11:172The FTC fiscal year runs from October 1 of the previous calendar year through September 30. Note additionally, if a Part 3 Administrative Complaint were accompanied by an Authorization to seek a Preliminary or Permanent injunction in federal court, this is counted as a single action. Id.
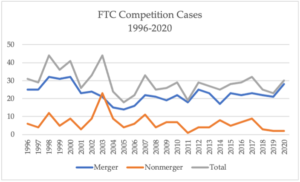
The data do not reveal any strong trends over this time period, though the number of total actions appears somewhat lower in recent years than in earlier ones. The total number of yearly actions appears roughly similar, if a bit higher, for these years as compared to the 1950s and 1960s data Judge Posner reported. But recall that Judge Posner conducted his own method of defining “competition” cases; while likely similar, again it is possible the modern and historical data used slightly different definitions.173Recall that Judge Posner limited his data to FTC restraint of trade cases, excluding deceptive practices cases, cases involving “in essence a private business tort (such as commercial bribery),” and Robinson-Patman cases. Posner supra note 155, at 369. The HSR Act was not passed during the period Judge Posner’s data captured; since then, FTC competition actions have skewed heavily towards premerger notification efforts.
Throughout recent decades, private lawsuits have trended significantly higher than government-led suits. As Crane notes, private yearly filings between 2006 and 2015 were above 500 each year (and over 1,000 in a couple earlier years of this period).174Daniel A. Crane, Toward a Realistic Comparative Assessment of Private Antitrust Enforcement, in Reconciling Efficiency and Equity: A Global Challenge for Competition Policy 341, 343, 343 fig.17.1 (Damien Gerard & Ioannis Lianos, eds., 2019). This fact leads him to conclude that “private antitrust remains the bedrock of US antitrust enforcement.”175Id.
Finally, it is important to note in this discussion that, just as the economy more broadly experienced the globalization phenomenon, especially from the 1990s onward, so too did competition law. While Canada and the United States adopted their antitrust legislation by the close of the nineteenth century,176See generally An Act for the Prevention and Suppression of Combinations Formed in Restraint of Trade, 1889, 52 Vict., c.41 (Can.); see also Thomas W. Ross, Introduction: The Evolution of Competition Law in Canada, 13 Rev. Indus. Org. 1, 3 (1998); Sherman Antitrust Act of 1890, 15 U.S.C. §§ 1–7. most of the rest of the world did not do so until the late twentieth or the early twenty-first century. Until 1970, merely one dozen jurisdictions had competition laws, and only seven of these jurisdictions had an active competition authority.177Org. for Econ. Coop. & Dev., Competition Trends 2020, at 3 (2020) (“In 1970, only 12 jurisdictions had a competition law, with only seven of them having a functioning competition authority. Today, more than 125 jurisdictions have a competition law regime, and the large majority has an active competition enforcement authority.”). By the 1990s, still only around twenty jurisdictions had competition law regimes. But today, at least 133 jurisdictions have adopted competition laws.178Id.; see also Anu Bradford, Adam S. Chilton, Christopher Megaw & Nathaniel Sokol, Competition Law Gone Global: Introducing the Comparative Competition Law and Enforcement Datasets, 16 J. Empirical Legal Stud. 411 (2019).
III. Exploring the Connection Between Antitrust and Income Inequality
The potential connections between antitrust enforcement and income inequality have deep historical roots. The TNEC Report issued eighty years ago demonstrates the longstanding nature of the argument that there exists an “intimate relation” between income distribution and competition.179TNEC Concentration, supra note 2, at 1. That report argued that the “distribution of income in recent times reflects the existing monopolistic elements in the economy and, through the transmission of wealth derived from earlier monopolistic situations, the elements of industrial monopoly that have prevailed in the past.”180Id. This proposition resonates as much today as ever.
Indeed, much of the current debate regarding income, inequality, and antitrust relies upon just this notion. Many of the alleged monopolies of the day have changed. The TNEC Report heavily focused upon more traditional industries such as railroads and natural resources like copper and aluminum. Today, greater concerns tend to fall within areas of developing technologies, information, and data. But some purported monopolists have held steadfast, such as among financial markets and real property concerns. And concerns regarding emerging markets persist.181See id. (listing “the rapid expansion of new industries such as agricultural machinery, electrical appliances, motion pictures, chemicals, and radio” among the “situations provid[ing] the basis for many of the large fortunes and in all of them strong elements of monopoly are found”).
Despite its age, the connection between inequality and antitrust remains underexplored. The arguments offered today do not meaningfully move the needle beyond what the TNEC’s 1940 report conveyed: monopolistic behavior skews income distribution, and that skewed income distribution fosters further monopolistic behavior. One trend begets the other.
The corpus of literature grappling with income inequality trends and their derivations fails to identify antitrust enforcement or policy as an important causal factor. While this does not eliminate some level of contribution or importance to antitrust, it does raise serious questions regarding antitrust’s actual role. If its effect were truly powerful, it would seem that this vast literature should have uncovered its force. Yet, antitrust remains an elusive agent; many suspect its import, but it remains largely a shadowy suspect thus far.
The goal here is to begin a more rigorous examination of antitrust enforcement’s effect on the distribution of income. This Section begins by deconstructing the theories as to how antitrust may impact income inequality and identifying the factors on which to focus the analysis. The section then shifts to reviewing available empirical evidence relating to monopoly power, antitrust enforcement, and income distribution. Finally, it turns to a consideration of the United States’ experience with antitrust enforcement and inequality over the last century.
A. Theoretical Underpinnings of the Antitrust-Income Distribution Connection
There is a persistent and compelling argument that antitrust policy, through its power to curb monopolistic abuses, may also be a powerful force for improving the distribution of income. At the highest level, these theories are based upon the notion that the beneficiaries of monopoly power are the wealthy, and the victims are the rest of society. So, the more monopoly power is exploited, the more the wealthy benefit while the rest are harmed. There exist today at least three discrete, developed avenues by which monopoly power and behavior are thought to distort the income distribution and to play into an increasingly skewed system.
First, is a first-order or direct effect. Perhaps the simplest argument, it states that monopolistic surcharges harm consumers, who are forced to pay more, and benefit the incumbent monopolist. Because the monopolists are already wealthy (by virtue of their market position), then the wealthiest benefit at the expense of the rest of the distribution.182See, e.g., Joshua Gans, Andrew Leigh, Martin Schmalz & Adam Triggs, Inequality and Market Concentration, When Shareholding is More Skewed Than Consumption 11 (Nat’l Bureau of Econ. Rsch., Working Paper No. 25,395, 2018). (“By increasing producer surplus and decreasing consumer surplus, monopoly power effectively acts to transfer resources from low-income families to high-income families.”).
Second, is the second-order or vicious cycle story. This line of argument proceeds as follows: at least some of the monopoly rents go to shareholders. Shareholders are also disproportionately wealthy and at the top of the income distribution. Thus, even if these shareholders face a monopolistic surcharge in the product (or service) market, some of that surcharge is dissipated through shareholder returns. Again, the wealthiest benefit from monopoly charges at the expense of the rest of the distribution.183See, e.g., Eric Posner & E. Glen Weyl, Mutual Funds’ Dark Side, Slate (Apr. 16, 2015, 9:46 AM), https://perma.cc/PVU6-64RC. These first two avenues are closely related, deriving from how the costs and benefits of monopoly rents are dispersed across the income distribution.
Third, is really a bit of a different concern from the first two. Whereas the first two theories relate to who pays and who benefits from monopoly pricing on goods and services, the third relates to how monopsonistic power commanded by employers might impact how laborers are paid. While the first two essentially consider most of the distribution in their roles as consumers, this theory focuses on their roles as workers. Note that, under the modern consumer welfare standard, workers may also be considered a “consumer” for purposes of antitrust analysis. Given the polarization of incomes and jobs in recent years, this third avenue may be especially relevant or worthy of further exploration.
Note that each of these theories tends to focus upon how antitrust enforcement (or a lack thereof) might skew inequality by benefiting the top earners at the expense of the rest of the distribution. That is, they seem largely to be stories about how a limited set of stakeholders make themselves better off at the expense of the general population, or of “how the rich get richer.” While these theories imply that generally prices will be higher and incomes will be lower for the general population, they do not clearly discriminate between middle- or low-income earners or occupations. That is, there is little nuance regarding how the remainder of the distribution fares. This is noteworthy particularly because of the polarization trends: the antitrust theories espoused thus far do not seem to predict, specifically, why workers would be increasingly funneled toward the poles of the spectrum and away from the middle, which had been a burgeoning area. These ideas will be explored further below.
The notion that antitrust enforcement may be closely linked to the distribution of income and capital within society thus has some intuitive appeal. The TNEC Report described this relationship as allegedly “interacting and cumulative.”184TNEC Concentration, supra note 2, at 1. Despite the simplicity and facial appeal of this idea, there remains an outstanding question of just how interacting and cumulative these effects might actually be.
Today, proponents of this notion tend to point to an apparent correlation between antitrust law and income inequality trends since about 1980.185See discussion supra Section II.C. As discussed above, since around the 1970s (and at least by the 1980s), the top 1% of income earners has continued to increase its share of total national income.186Id. Meanwhile, since at least 1980, antitrust law has consistently applied the consumer welfare standard as its mechanism for determining liability. Critics of this standard argue it is too lenient; that it has meaningfully diminished antitrust enforcement, and allowed the interacting and cumulative effects of monopoly and income inequality to proliferate.187Id.
Assuming for the moment the argument that antitrust enforcement meaningfully declined beginning by about 1980, this observation does no more than cite simultaneous (alleged) phenomena. Going beyond merely identifying the two concurrent trends, and conducting a more rigorous analysis regarding whether antitrust law and enforcement efforts have contributed—be it significantly or marginally—to the observed income trends, requires identifying data points such as which factors change when and what else changes or is held constant. For this exercise, closer to a century of information is available rather than only the last forty years.188See infra Section III.C.1.
It is important to elucidate the assumptions inherent to these theories to understand comprehensively the theoretically mechanism of harm before proceeding to an analysis of whether the theories appear consistent with the observed trends relating to income distribution and job polarization. First, we might consider the theory relating to direct wealth transfers. At the basic level, monopoly pricing transfers rents from consumers to producers. These categories are not necessarily synonymous with “wealthy” and “less-wealthy,” respectively. The theories of contribution to income inequality, though, generally assume that the beneficiaries of monopoly rents are the wealthy, while the impaired are the majority (the rest).189Jonathan B. Baker & Steven C. Salop, Antitrust, Competition Policy, and Inequality, 104 Geo. L.J. Online 1, 11–12 (2015) (“The returns from market power go disproportionately to the wealthy—increases in producer surplus from the exercise of market power accrue primarily to shareholders and the top executives, who are wealthier on average than the median consumer.”). As developed further below, there is a very real, outstanding question of particularly whether and how the top one or 0.1% fit into this tale. But for now, the simpler assumption is that those benefiting are already wealthy.
In many instances, this might very well be true, but as the literature has begun to explore, it might also be a bit misleading.190See, e.g., Daniel A. Crane, Antitrust and Wealth Inequality, 101 Cornell L. Rev. 1171 (2016); Daniel A. Crane, Is More Antitrust the Answer to Wealth Inequality?, 38 Regul. 18 (2015). The derivation of the market power, for instance, might matter greatly to whether this assumption bears out; as might the underlying product or service. For instance, cartels are often formed precisely because the market participants are in a precarious or diminishing position and attempting to create artificially rents they have not (yet) been able to obtain individually.191See, e.g., Crane, Antitrust and Wealth Inequality, supra note 190, at 1174–76. Indeed, many cases the DOJ and FTC have brought over the years demonstrate such efforts. The FTC investigated and settled, and the DOJ indicted individuals in, a matter involving home physical therapist service providers, comprised of just a few employees, for agreeing to raise prices.192See Press Release, U.S. Dep’t of Just., Former Owner of Health Care Staffing Company Indicted for Wage Fixing (Dec. 10, 2020), https://perma.cc/5QCR-ZZNJ; Indictment, United States v. Jindal, No. 20-cr-00358 (E.D. Tex. Dec. 9, 2020), https://perma.cc/7NE6-SYEL; In re Your Therapy Source, LLC, No. 171-0134, 2018 WL 3769236 (F.T.C. July 31, 2018). Here, the alleged monopolistic abuse was, almost certainly, not perpetrated by a member of the top one percent. Thus, there appear to be important limitations and deviations to bear in mind—particularly as we consider antitrust enforcement efforts.
Similarly, there may be myriad complexities in assessing the effect of a given enforcement action upon income inequality concerns. Consider, for instance, a proposed merger of hospital systems. Such a merger might have differing effects on pay for different stakeholders at different locations along the income distribution; for example, doctors versus nurses or staff; or even within these groups, such as orthopedics versus ICU or gynecology, or administrative versus janitorial or kitchen staff. The point here is merely to highlight the various ways in which one transaction might yield different, in magnitude or directions, effects in terms of income.
Moreover, the consumption patterns relating to the product or service at issue might also have important distributional effects in practice.193See, e.g., Crane, Antitrust and Wealth Inequality, supra note 190, at 1204 (“The relatively wealthy can be exploited through the exercise of market power at least as much as—and perhaps proportionately more than—the relatively poor.”). If, for example, monopoly pricing arises in grocery or convenience stores—places where consumers buy basic necessities—that is likely to have more regressive effects and disproportionately harm lower-wealth consumers.194See infraPart IV. On the other hand, if the good or service is more of a luxury—say, high-end sunglasses195See, e.g., Press Release, Fed. Trade. Comm’n, Statement of the Federal Trade Commission Concerning the Proposed Acquisition of Luxottica Group S.p.A. by Essilor International (Compagnie Generale d’Optique) S.A., FTC File No. 171-0060 (Mar. 1, 2018), https://perma.cc/P8VX-G74L; see also Crane, Antitrust and Wealth Inequality, supra note 190, at 1205 (“[T]o pick a famous monopolization case, one can ponder the wealth distribution effects in Aspen, Colorado—playground of the rich and famous—when the Aspen Skiing Company decided to jettison its cooperation with the rival mountain owned by Highlands.”). or other products—then the monopoly pricing will, by definition, be primarily borne by those more well-off. Accordingly, there are important foundational questions relating to who actually receives or pays monopoly rents, which has implications for its relation to the distribution of income.196Crane further critiques the assumption that monopoly rents are received by the wealthier and borne by the less-wealthy. See, e.g., Crane, Antitrust and Wealth Inequality, supra note 190, at 1198 (“[T]he point is that claims that the chief beneficiaries of monopoly power are large corporate shareholders and managers is altogether too facile. The actual operation of the antitrust laws, both in terms of the cases that are publicly brought and their often invisible deterring effects, is considerably broader.”). Again, these questions will be pertinent in the exploration of income distribution trends, job polarization, and antitrust enforcement that follows.
Additionally, there is an important question of whether employees at firms with market power share, to some extent, in the supracompetitive rents the firm earns. The theories of harm outlined above presume that employees at powerful firms are worse-off—they are paid less than they would be in a competitive market. There is an important distinction between whether a “powerful” firm has market power only on its sales side (monopoly power), or also has market power on its buying side (monopsony power). Often, these notions appear to be conflated in popular conversations, and large, multi-national firms are presumed to command both monopoly and monopsony power. But the existence of one or the other is critical for proper analysis—and proper remedial strategies. For instance, evidence suggests that firms and workers might share, to some extent, in product market rents.197See Jason Furman & Peter Orszag, A Firm-Level Perspective on the Role of Rents in the Rise in Inequality, Presentation at “A Just Society” Centennial Event in Honor of Joseph Stiglitz at Columbia University, at 14 (Oct. 16, 2015), https://perma.cc/5XB5-B3FW (discussing the literature on rent sharing); see also Crane, Is More Antitrust the Answer to Wealth Inequality?, supra note 190, at 19–20. This would imply that employees at firms with market power are not harmed, but actually better off than they would be in a more competitive market.
Again, the discussion so far has been limited to outlining the theories by which antitrust might contribute to inequality, generally. Below, we explore antitrust enforcement, these theories, and observed trends in recent years, to examine more rigorously antitrust’s potential contribution to observed outcomes.
B. Empirical Evidence Examining the Link Between Antitrust Enforcement and the Distribution of Income and Wealth
There is limited empirical work exploring quantitatively the potential connection between antitrust law and policy and inequality. There is a set of nascent literature generally attempting to examine monopoly power and the distribution of income or wealth. One of the first efforts sought empirically to consider the distributive consequences of monopoly power on wealth accumulation in the United States.198William S. Comanor & Robert H. Smiley, Monopoly and the Distribution of Wealth, 89 Q.J. Econ. 177 (1975). This early effort contained strong assumptions and important limitations, but its findings suggested that monopoly power strongly “contributes to the process of wealth creation.”199Id. at 194; see also John J. Siegfried, Rudolph C. Blitz & David K. Round, The Limited Role of Market Power in Generating Great Fortunes in Great Britain, the United States, and Australia, 43 J. Indus. Econ. 277, 282–83 (1995); Sean Ennis, Pedro Gonzaga & Chris Pike, Inequality: A Hidden Cost of Market Power, OECD, at 7 (2017), https://perma.cc/9YJQ-DKWK (“The Comanor and Smiley (1975) model and assumed parameters for calibration have been suggested to contain substantial limits, though in our view the paper still provides a useful basis to obtain a notion of the dimension of the effect.”). Note that this analysis did not focus specifically upon the distribution of income, as this Article does, but rather more broadly upon accumulation of wealth across households.
Later work reached similar results,200See, e.g., Siegfried et al., supra note 199, at 283 (noting that a study by Lankford & Stewart attributed approximately 35% of the wealth held by the top 0.1% to market power). while also illuminating the importance of fortunes derived in competitive markets.201Id. at 278–83. One study, published in 1995, found surprising results relating to the amount of wealth created in industries designated as competitive in the United States, United Kingdom, and Australia through the late 1980s or 1990—and speculated that this could reflect factors including “more aggressive antitrust enforcement,” though this explanation was not further explored.202Id. at 278–79 (arguing “[f]rom this evidence it appears the effect of market power on the distribution of wealth among the wealthiest individuals is declining over time, especially in Great Britain. This trend could reflect shifts in economic structure (i.e., a less important role for manufacturing), growth in market size, changes in regulatory posture (i.e., more aggressive antitrust enforcement and deregulation), and/or technological advances in transportation and communications that reduce the importance of scale economies.”).
Additional work building upon this early effort sought to fill the empirical gap, proposing a new model attempting to address some of the limitations present.203Ennis et al., supra note 199, at 7. These authors concluded:
Market power may contribute substantially to wealth inequality, augmenting wealth of the richest 10% of the population by 12% to 21% for an average country in the sample. . . . Market power may also depress the income of the poorest 20% of the population between 14% and 19% for an average country in the sample.204Id. at 23.
They further analyze the effects of reducing mark-ups by 1% across several countries, finding that doing so is likely to benefit lower wealth quintiles, while the costs are likely to be borne by the highest quintile.205Id. at 22, 39 fig.4. This work, again, has important limitations, but may help develop our understanding of the interplay between monopoly power and wealth. As the authors recognize, this work does not distinguish between lawful—or even government-created—monopoly power and unlawful monopoly power.206Id. at 23 (“[M]ore work is needed to understand the likely scale of different sources of market power, ideally divided into at least three categories: legally obtained without government help, legally obtained with government help (e.g. due to competition-restricting regulations) and illegally obtained market power.”). And they disclaim the notion that competition law should deliberately target inequality, arguing instead that “reduced inequality is a beneficial by-product of government actions and policies to reduce illegitimate market power.”207Id.
Another more recent study explores the conditions under which “market power can transfer wealth from consumers to shareholders, what impact these mechanics can have on income inequality, whether these conditions are met in practice, and how those facts have changed over the past three decades.”208Gans et al., supra note 182, at 2. This analysis examined the distribution of expenditure, income, and corporate equity (defined as the sum of stock holdings and business equity) between 1989 and 2016. It found first that “corporate equity is considerably more skewed than expenditure or income and has become considerably more skewed over the past three decades.”209Id. at 8. This finding is consistent with the general assumption that wealth will be less evenly distributed than income, both of which will be less equally distributed than consumption.
This analysis then seeks to disentangle the effect of market power on the distribution of income. The authors compare incomes for the top quintile and the bottom three quintiles as they were observed, and compare them to the “hypothetical case of fully competitive markets.”210Id. at 10. They find that removing market power would increase the share of the bottom three quintiles from 19 to 21%, and decrease the share of the top quintile from 64 to 61%.211Id. Their results suggest an absence of market power would “somewhat equalise the distribution of incomes, but also puts into perspective the size of the impact.”212Id. Indeed, these changes seem quite modest, particularly given the authors’ analysis removes market power. There are many critiques today that markets are too concentrated; that market power is pervasive in the modern economy. Assuming arguendo that is true, if competition and antitrust enforcement were a significant cause of growing income inequality, one would expect the effect of removing monopoly power entirely would have a more substantial impact.
Recall further that monopoly, alone, is neither unlawful nor entirely undesirable. The possibility of monopoly profits creates critical incentives driving robust competition. The law, therefore, outlaws only abuses of monopoly power, not the mere fact or existence of that power. In this analysis, it seems the authors do not distinguish between “good” or “neutral” monopoly power and “bad” or undesirable monopoly power.213Id. at 2–3. That has important implications for their findings. That the authors remove all market power could suggest that the modest effects observed on income distribution represent an upper boundary that would never be observed in the real world, even with perfect enforcement. This suggests further that antitrust enforcement, alone, is unlikely to affect meaningfully the strong income distribution trends we have observed over the last several decades. Indeed, the authors’ own analysis demonstrates that the impact of removing all market power does little to slow this trend—it does represent a hard brake, let alone a reversal.
The empirical literature discussed so far attempts to distill the impact of monopoly or market power upon the accumulation or distribution of wealth. Another strain of work, yet largely undeveloped, may seek to understand the impact of antitrust enforcement upon inequality. As discussed, determining the appropriate measure of enforcement to test this impact is not totally clear, and different choices may yield different results (which, in turn, might provide greater or lesser insights). But it is another method by which we might explore how antitrust law and policy affects inequality trends, and so enhance our overall understanding, if modestly so. One recent paper considers the effect of DOJ investigations (merger investigations and all investigations) on consumption expenditures, income shares, and wealth shares between 1984 and the mid-2010s.214Joshua D. Wright, Elyse Dorsey, Jonathan Klick & Jan M. Rybnicek, Requiem for a Paradox: The Dubious Rise and Inevitable Fall of Hipster Antitrust, 51 Ariz. St. L.J. 293, 334–41 (2019).
This analysis failed to uncover statistically significant results; and in some cases, the signs of the effect of the investigations switched across measurements. These results are arguably informative regarding the current debate over antitrust and inequality. Recall the adoption of the consumer welfare standard and the modern trend in income inequality began shortly before the period covered in this analysis. If antitrust enforcement had a significant impact upon the income inequality trend, we might expect more of that to bear out in analyses like this. Admittedly, there are likely many factors contributing directionally to increasing the income inequality trend; but inability of data (so far) to identify even a meaningful tie to antitrust law or enforcement has at least something to say about its likely level of impact.
Related to the third theory by which antitrust enforcement might drive or reinforce inequality trends, is the allegation of monopsony—in this case employer-side—power. There is a developing literature exploring how labor market monopsony power might impact wages. One recent study seeks to “directly quantify the level of labor market concentration across nearly all occupations and for every commuting zone in the US.”215Jose A. Azar, Iona Marinescu, Marshall I. Steinbaum & Bledi Taska, Concentration in US Labor Markets: Evidence from Online Vacancy Data 1 (Nat’l Bureau of Econ. Rsch., Working Paper No. 24,395, 2019), https://perma.cc/NM4K-JTEM. This study focuses upon how merger activity might impact labor market power and wages. According to the authors’ analysis, they “show[] that concentration is high (above 2,500 HHI) in 60% of US labor markets according to our baseline market definition, and in at least a third of US labor markets according to alternative labor market definitions.”216Id. at 22. “HHI” refers to the Herfindahl-Hirschman Index, which is a measure of market concentration that sums the squares of each individual firms’ market share. The Horizontal Merger Guidelines define “highly concentrated markets” as those with an HHI above 2500. U.S. Dep’t of Just. & Fed. Trade Comm’n, Horizontal Merger Guidelines § 5.3 (2010), https://perma.cc/NX3C-SDJW. They present a figure demonstrating the average HHI by occupation for the thirty largest occupations analyzed:
Figure 12: Average HHI by Occupation, based on vacancy shares, for the 30 largest occupations217Azar et al., supra note 215, at 34 fig.4.
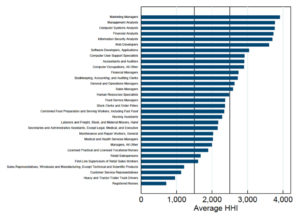
What is perhaps most interesting for purposes of this Article is to consider how these occupations compare with those in the top percentage of income earners, and how concentration varies across these occupations. Once again, it is likely there are some variations between the data sets in terms of designations, so care must be taken in extrapolating from one to another. But a preliminary analysis might help to illuminate further work and the path forward.
Recall that “executives, managers, and supervisors (non-finance)” and “financial professionals including managers” comprised a large and increasing share of the top income earners. The Figure above shows that “marketing managers,” “financial managers,” “sales managers,” and “financial analysts” are in the top half (top fifteen), each with greater than 2,500 HHI. Other occupations that would appear to be higher-education, high-income also appear to be more highly concentrated. For instance, “management analysts,” “computer systems analysts,” “information security analysts,” and others, would seem to align to an extent with the “computer, math, engineering, technical (nonfinance) occupations were professions represented in the top 1% of income earners. In other words, despite higher employer-side power, these employees remain highly paid. Of course, Figure 4 also shows that other “manager” categories, like “managers, all other,” and “medical and health services managers,” are meaningfully less concentrated, which might factor in. Meanwhile, certain occupations that the labor market literature identifies as low-education, low-income—such as “combined food preparation and serving workers, including fast food” “laborers and freight, stock, and material movers, hand”—are comparatively, and in some cases significantly, less concentrated. Even in the face of comparatively lower employer-side concentration in these occupations, these employees are still less well-paid.
One particularly interesting observation in this Figure is occupations deemed “secretaries and administrative assistants, except legal, medical, and executive” appear relatively less concentrated (ranking 22nd) among the largest occupations. This is notable because these roles are typically cited as the quintessential example of the vanishing middle-class job—those comprised largely of routine tasks that are prone to automation.218See, e.g., Brad Hershbein & Lisa B. Kahn, Do Recessions Accelerate Routine-Biased Technological Change? Evidence from Vacancy Postings, 108 Am. Econ. Rev. 1737 (2018); Lisa B. Kahn, Changes in the Character of the Labor Market over the Business Cycle, 2 Nat’l Bureau Econ. Rsch. Rep. 14 (2019); Maarten Goos, Alan Manning & Anna Salomons, Explaining Job Polarization: Routine-Biased Technological Change and Offshoring, 104 Am. Econ. Rev. 2509 (2014). Despite monopsony power being comparatively lower here, these occupations are nevertheless experiencing decreasing market presence and wages.
Again, the comparisons across these various works are preliminary and not perfectly matched; the story is not entirely clear, and final conclusions cannot be assuredly reached. But this initial analysis suggests that monopsony power is unlikely to be a driving force behind the observed trends of wage and job polarization. This is not to say that the existence of, or changes to, employer-side monopsony power in labor markets does not impact wages; rather, it is only to suggest that it is not likely the motivating force behind the particular trends this Article analyzes.
Overall, the empirical literature analyzing the connection between monopoly, antitrust, and wealth or income distributions seems a bit of a mixed bag. While some preliminary work suggested a strong relationship; other more recent work suggests a far more modest causal relationship, if one exists at all. The corpus of literature seems to suggest a potentially stronger relationship between monopoly power and total wealth accumulation than between antitrust enforcement and the distribution of income.
C. Antitrust Enforcement, Income Inequality, and Job Polarization: U.S. Experience
As developed above, both the distribution of income and antitrust enforcement have evolved meaningfully over the last century in the United States. This development provides an exciting opportunity to examine more in depth the two factors over time, and to begin elucidating whether antitrust enforcement is—as it has been criticized to be—contributing to the growing income inequality (and related job polarization) that we observe today.
Some scholars argue that antitrust enforcement can or should be used to combat income inequality trends.219See Stiglitz, supra note 8, at 338–3. Some of their work emphasizes the benefits modern antitrust enforcement might have upon inequality;220See, e.g., Baker & Salop, supra note 189; Ennis et al., supra note 199. while other work argues antitrust law should be altered and more directly incorporate socio-political concerns such as inequality.221See, e.g., Khan & Vaheesan, supra note 125, at 276–79. None of these scholars attempt to explore directly patterns in antitrust law and enforcement and in the distribution of income and job polarization.
Recall the income distribution literature clearly demonstrates that the top 1 or the top 0.1% of income earners have an outsized impact upon the overall distribution. So, one threshold question to consider is how the theories relating to antitrust law and enforcement may (or may not) be contributing to this particular trend. The theories discussed so far, and all those I have been able to identify, rely upon general notions of wealth transfers that might contribute to inequality at a high level. These theories generally assume that monopolistic pricing transfers wealth from consumers—who tend to be less wealth—to producers—who tend to be wealthier. Or that monopsonistic pricing in labor markets has helped to suppress wages. What they do not predict, however, is that the highest 1 or 0.1% of income earners, in particular, should be realizing outsized gains, while the rest of the distribution sees modest (or no) gains. Nor why the rest of the distribution is increasingly being polarized—both in terms of occupations and in terms of wages.
Perhaps the natural starting point for the analysis of how antitrust might be impacting long-term income distribution trends is the Great Compression. This was the first significant inflection points uncovered in the income distribution trend. Over just a handful of years, the distribution of income became far more equalized. That shock to the distribution was driven in part by a drop in the share going to the top decile222Recall that compression in the lower distribution (primarily from increasing minimum wage) also contributed to the Great Compression. This Article focuses upon the effects and trends of top earners, as more data is readily available and a discussion of the effects of minimum wage is outside the scope of the discussion here.—particularly the precipitous decline in the shares of income commanded by the top one and top 0.1%. Their shares began dropping by 1941, and had bottomed out by about 1945.
At the same time, particularly 1940 and 1941, the number of DOJ-initiated lawsuits jumped to historical records.223See Posner, supra note 155, at 366–69, 366 tbl.1, 369 tbl.. Thurmond Arnold began his tenure as Assistant Attorney General in charge of the Antitrust Division in 1938, and the number of cases the DOJ filed 10 cases in 1938, to 31 cases in 1939, 65 in 1940, and 71 in 1941. In 1942, the number of initiated cases began decreasing again, down to 46, then 22 in 1943; it remained around this rate for most of the rest of the decade. This inverse relationship between the number of DOJ-initiated cases and share of income flowing to the top income earners holds some initial promise. It is consistent, at least, with antitrust enforcement playing an important role in distributing income.224This might particularly be apparent if the assumption that the effects of litigation tend to lag behind the date of filing holds.
Further analysis, however, tends to undermine antitrust’s role here. Piketty and Saez, for instance, demonstrate that not only the United States, but also the United Kingdom and France, experience the precipitous decline in the share of income held by the top 0.1% in the few years of World War II:
Figure 13:225Piketty & Saez, supra note 29, at 36 fig.XII.
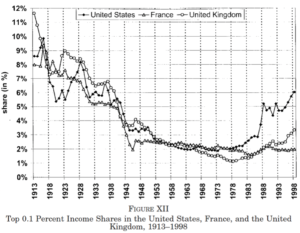
Neither the United Kingdom nor France had competition law statutes during this time. The first UK legislation was not adopted until 1948;226Jeremy Lever, The Development of British Competition Law: A Complete Overhaul and Harmonization2–4 (Wissenschaftszentrum Berlin für Sozialforschung, WZB Discussion Paper No. FS IV 99-4, Berlin, 1999) (“Until 1948 the United Kingdom’s competition law was provided exclusively by the common law, that is to say judge-made case law. During the 18th and 19th Centuries the judges developed what came to be called the common law doctrine of undue restraint of trade. . . . The common law doctrine of restraint of trade, together with its severe limitations, forms part of the legal background to the enactment by the UK Parliament of the UK’s first competition law statute, namely the Monopolies and Restrictive Practices (Inquiry and Control) Act 1948.”). and France did not adopt its modern competition legislation until 1986.227Competition History, Autorité de la concurrence, https://perma.cc/5KTN-UL6J (“It was not until 1986 that a proper competition policy was developed, thanks to the adoption of the Ordinance of 1 December 1986, which laid the foundations of the market economy, brought an end to price regulation and created the Conseil de la concurrence. In 2008, the Law on Modernisation of the Economy (LME) established the Autorité de la concurrence, which had more extensive powers and replaced the Conseil de la concurrence.”). The Treaty of Rome, which established the European Commission, similarly was not signed until 1957, well after the precipitous drop in income inequality; while competition law had a prominent role, it cannot explain this particular phenomenon.228See id. Thus, while this data do not preclude that antitrust enforcement had some contributing effect to the Great Compression observed in the early 1940s, nor does the weight of the data offer meaningful support for the notion that antitrust law or policy was in an important causal factor.
In fact, this graph demonstrates that income shares for the top earners within the United States, France, and the United Kingdom experienced similar progressions throughout the early to mid-twentieth century. It is only around the late 1970s that the United States begins to deviate. Now, consider what is—and perhaps more importantly, what is not, happening in antitrust enforcement in these countries during this time. By this time, both the United States and the United Kingdom. had been enforcing their antitrust laws for some time. France’s antitrust law did not take effect until a few years after the share of income held by the top 0.1% in the United States. began to deviate from its own (and recall the European Union was in place and had begun its own efforts earlier). Without considering enforcement trends in these other jurisdictions during most of the twentieth century, a competition regime’s existence does not seem to be driving the changes observed.
Further, antitrust law fails to emerge as a strong causal factor during this time period. At this point, far more of the top earners’ incomes derived from capital rather than wage income. The antitrust theories relating to the accumulation of wealth, as espoused in the TNEC Report, for instance, tend to focus upon the reinforcing role of capital wealth accumulation. Despite that capital incomes played such a large role in the trends and the compression, antitrust law’s effect appears minimal, at best. This portends a difficulty for antitrust explanations in later periods, when capital is less of a driver in income trends.
Over the several decades comprising the mid-twentieth century, the income distribution seems to stay relatively stable. Shares going to the top income earners do not appear to exhibit meaningful changes for about three decades following the Great Compression. As noted above, antitrust enforcement in the mid-twentieth century has been described both as ineffective and schizophrenic, and as a golden age.229See, e.g., Stoller, supra note 153 (“golden age”); Robert H. Bork & Ward S. Bowman, Jr., The Crisis in Antitrust, 65 Colum. L. Rev. 363, 364 (1965) (attributing the existence of conflicting antitrust laws in the 1960s as demonstrating “the schizophrenia afflicting basic antitrust policy”). As developed above, in terms of the number of cases agency antitrust cases filed and agency win rates in the Supreme Court, no clear trend emerges which might facilitate more specific testing of the antitrust-inequality relationship. Overall agency case filings increased only modestly, and their rate of prevailing at the Supreme Court remained fairly stable. Income inequality likewise exhibited no major changes during this period. Accordingly, there appears little data upon which either to rule out or to strengthen the theory that antitrust played some role in restraining income inequality during this time. Recall Figure XII, in which income inequality exhibited similar patterns in the United States, the United Kingdom, and France through the 1980s. Given that antitrust law and enforcement were at different stages across these countries in these decades, it would seem factors aside from antitrust are most likely driving the observed trends during this period.
After around 1980, both antitrust enforcement and income inequality trends exhibit clear changes. Substantive antitrust law and enforcement policies and priorities began to shift around this period. And income inequality began rapidly increasing—a trend which appears to continue today. Examining the data in more depth may disentangle correlation and potential causation. In this endeavor, it behooves the analyst to bear in mind other key changes that were occurring: For instance, recall that the drop in top earners’ income during the Great Compression was largely a capital-income story, as the top earners in this period tended to derive most of their income from capital (many were rentiers); whereas today, far more of the income tale is about wage earnings. Furthermore, the economy and its demands on workers have developed significantly, with increasing educational-skill demands and global competition.
Consider first the argument that increasing industry concentration is a result of lax antitrust enforcement and contributes to growing inequality. If this were the case, what empirical evidence might one expect to be able to observe? Perhaps those at the top—the alleged monopolists—in more highly concentrated industries (or those exhibiting increasing levels concentration) increasingly comprising the top percentage of income earners. Or perhaps certain industries where concentration has increased exhibit lower compensation for the remainder of workers. The literature on income inequality, however, does not seem to evince overly strong industry-level (or market-level) trends in recent decades. Most—though perhaps not all—of the observations seem to defy traditional industry designations, and instead appear to identify trends based upon factors such as underlying tasks or skill or education levels.
Next, consider the occupations comprising the top percentage of income earners and how this composition has changed in recent decades. Executives, managers, and supervisors comprised the single largest category throughout the observed period. This category does not conform to industry designations or to antitrust-relevant markets.230Setting aside, for the moment, the possibility of competition for “executives” or other employees in this category. Other categories in the top income earners that do not align with industry-level designations include computer, math, engineering, technical (nonfinance); business operations (nonfinance); arts, media, sports; and lawyers. Some categories, however, appear somewhat closer to an industry-level category, such as financial professions, including management; real estate, and medical. How has concentration in these industries altered over time? Jason Furman and Peter Orszag provide data on the percentage point change in revenue share earned by the fifty largest firms in certain industry categories between 1997 and 2007.231See Furman & Orszag, supra note 197. Their data show that “finance and insurance” rose by 7.4 percentage points, “real estate rental and leasing” rose by 6.6 percentage points, while “health care and social assistance” declined by 3.7 percentage points.232Id. at 11 tbl.1. Meanwhile, between 1997 and 2005, for the percentage of primary taxpayers in the top one percent of the income distribution, “financial professions, including management” increased by 2 percentage points; “real estate” rose by 1.4 percentage points; and “medical” declined by 2.2 percentage points. Care must be taken here: the definitions used in the income inequality literature appear to differ from those used in Furman and Orszag’s analysis. More broadly, it is not clear how useful industry-level concentration trends are for antitrust analysis.233See, e.g., Wright et al., supra note 214, at 323–24; Elyse Dorsey, Geoffrey A. Manne, Jan M. Rybnicek, Kristian Stout & Joshua D. Wright, Consumer Welfare & the Rule of Law: The Case Against the New Populist Antitrust Movement, 47 Pepp. L. Rev. 861 (2020).
At a very preliminary glance, these trends appear at least directionally consistent, although the available evidence is very limited and (potentially important) distinctions between the categories examined exist. Moreover, at least some of the data appears to depend significantly on the particular starting year: for instance, if we were to consider the percentage change in “medical” in the distribution of income starting at 1999 rather than 1997, we would see an increase of 0.6 percentage points rather than a decrease. While the medical category remained fairly stable across the entire time frame, there was more fluctuation year-to-year within the period. The relevant point at this stage appears to be that this available evidence may be consistent with the notion that increasing industry concentration may be correlated with an increasing presence in the top one percent of income earners, with a strong caveat that this evidence is limited.
Another potential means of tying the alleged concentration trends to income inequality trends might be to consider whether antitrust enforcement—cases, investigations, etcetera—in certain industries or markets has changed in ways that might contribute jointly to these trends. Systematic evidence or reviews of antitrust enforcement efforts by industry or market is limited to date.234One potential source of raw data is the DOJ and FTC Annual Competition Reports, which provide the number, percent of total, and percentage point change from prior year by three-digit NAICS code designation of the acquiring party for HSR filings each year, for the last several years. See Fed. Trade Comm’n, Annual Competition Reports, https://perma.cc/L2P7-76T9. The criticisms of modern antitrust enforcement tend to argue that enforcement, broadly, is significantly more limited and less effective; that is, that antitrust across the board is functioning below par.235See Wright et al., supra note 214.
However, the occupations comprising top income earners is not the only available evidence. Recall the graphs discussed above presenting evidence of real, composition-adjusted log wages for workers with varying levels of education, as well as the percent change in employment by occupation between 1979 and 2009. The former presents the increasing college premium in recent decades; while the latter demonstrates the hollowing-out of traditionally middle-class jobs. Is there a role for antitrust in explaining these trends? To begin, it seems unclear how antitrust law or enforcement might dictate trends relating to compensation based upon education level. Antitrust focuses upon competition in relevant markets, a term of art delineating the locus of competition between firms offering a particular set of goods or services or, to frame it slightly differently for this analysis, those firms competing against one another for certain resources, such as employees. Myriad occupations may encompass an education level such as high school or college graduate, but only a small fraction might properly be considered within the same antitrust-relevant market.
Similarly, the graph showing percent change in employment by occupation appears to show a fairly strong trend of growth in low-education, low-income and high-education, high-income jobs, and low or negative growth in middle-education, middle-income ones. Here again, the trend—as so far examined—appears to defy traditional antitrust markets, or even industry-level designations. This would tend to suggest that factors other than antitrust law or enforcement are the motivating forces behind observed trends. Though again, it does not preclude some limited role for antitrust concerns.
Moreover, there is again some evidence from experiences outside the United States, which suggests caution in presuming antitrust concerns are important driving factors of recent trends. For instance, job polarization today seems to be impacting the European Union at least as much as it is the United States.236Acemoglu & Autor, supra note 3, at 17, 132 fig.11 (“Job polarization appears to be at least as pronounced in the European Union as in the United States.”); see also James Harrigan, Ariell Reshef & Farid Toubal, The March of the Techies: Technology, Trade, and Job Polarization in France, 1994-2007, at 2 (Nat’l Bureau of Econ. Rsch., Working Paper No. 22,110, 2016), https://perma.cc/33JN-LQU6 (“Job polarization—growth in the shares of high-wage and low-wage jobs at the expense of middle wage jobs—is one of the most striking phenomena in many advanced economies’ labor markets in the last several decades. . . . We show that, like many other countries, France has experienced job polarization . . . .”). The extent of this polarization, and its rapidity, likewise tend to exhibit similarities across other developed economies.237See, e.g., Harrigan et al., supra note 236, at 3 (“The magnitudes of changes are large and they occurred relatively rapidly. Despite very different labor market institutions, polarization in France from1994 to 2007 is comparable both in shape and in magnitude to polarization in the United States from 1980 to 2005. This suggests that similar forces are at play. We find that polarization in France is a strong force that increases inequality through reallocation of employment shares from middle-paying occupations to both high and low-paying occupations.” (footnotes and citations omitted)). As noted, the antitrust theories fail to predict or explain these particular polarization trends. That these trends seem to hold across similar countries and antitrust enforcement regimes is perhaps unsurprising then.
IV. The Redistributive Power of Antitrust
The analysis thus far presents a skeptical picture of antitrust law’s ability drive or reinforce income inequality trends, particularly those strong trends recently observed. This does not, however, mean that antitrust lacks any redistributive power or that specific antitrust enforcement actions cannot provide progressive consumer welfare benefits.
Indeed, antitrust enforcement might make those at the lower ends of the distribution better-off in very real ways.238See, e.g., Baker & Salop, supra note 189; Crane, Antitrust and Wealth Inequality, supra note 190. While antitrust’s capacity to drive large-scale income inequality trends appears limited, its ability to impact consumer spending appears stronger. Evidence suggests that focusing upon certain kinds of antitrust matters that might most directly benefit those lower on the income distribution might do real work in terms of equity. Of course, the distribution of benefits, even whether progressive or regressive, depends upon factors including the underlying good or service. While in many areas the distribution of benefits might be mixed, it is more likely to be progressive for various necessities, like healthcare or groceries.
Consider that lower income households disproportionately struggle to meet basic needs.239See, e.g., Brian Root & Lena Simet, United States: Pandemic Impact on People in Poverty, Human Rights Watch (Mar. 2, 2021), https://perma.cc/W2WU-T6F3; Laura Caron & Erwin R. Tiongson, The Pandemic Poverty Penalty: How COVID-19 Complicates Our Measure of Household Well-Being, London Sch. Econ. & Pol. Sci. (June 15, 2021), https://perma.cc/GU7P-PNCR. The COVID-19 pandemic seems only to have exacerbated these struggles over the last two years.240See, e.g., Root & Simet, supra note 239; Caron & Tiongson, supra note 239; Mike Brewer & Ruth Patrick, Pandemic Pressures: Why Families on a Low Income are Spending More During Covid-19, Resol. Found. (Jan. 2021), https://perma.cc/89RA-RQR4. Evidence suggests both that monopolistic pricing might tend to harm lower income households more than others, and that competition for basic goods like groceries might disproportionately benefit lower income households, who tend to spend a larger percentage of their incomes on these basic provisions.241See, e.g., John Creedy & Robert Dixon, The Relative Burden of Monopoly on Households with Different Incomes, 65 Economica 285, 291 (1998) (“The welfare loss associated with monopoly power was found to be higher for low-income households (such as those depending on government pensions and benefits for their principal source of income) than for high-income households. The results suggest that, whatever the size of the absolute welfare loss resulting from monopoly, there may be a substantial effect on the distribution of welfare. Nevertheless, the results must be viewed with much caution as they rest, as of course does much applied microeconomics, on strong assumptions.”); Jason Furman, Wal-Mart: A Progressive Success Story, Mackinac Ctr. for Pub. Pol’y 3 (Nov. 28, 2005), https://perma.cc/EZX2-GH8V (“As shown in Table 1, the benefits from big box grocery stores are equivalent to a 6.5 percent increase in income for the bottom quintile (average income of $8,201) and a 0.9 percent increase in income for the top quintile (average income $127,146).”). These households tend to be the most resource-constrained, meaning their ability to tolerate price increases is below average. They may more quickly be priced out of certain markets. Of course, price increases are not the only harm these households may face; quality-adjusted price increases, such as lower quality or service or diminished innovation might likewise negatively impact these households. However, harms associated with price increases, specifically, might disproportionately affect the lowest income households. Consider that the inability to access cheaper stores (for instance due to lack of transportation), or the unavailability of bulk discounts seem to be intimately related to the “poverty penalty.”242See, e.g., Caron & Tiongson, supra note 239 (“Poor households often pay more for goods and services than rich ones do. This concept is known as the ‘poverty penalty’. . . . [P]oor households often pay higher prices at local convenience stores when they do not have transport or access to cheaper stores, or because they do not receive bulk discounts.”); see also Ronald U. Mendoza, Why Do the Poor Pay More? Exploring the Poverty Penalty Concept, 23 J. Int’l Dev. 1 (2011). Because they are the most price sensitive, lower income households are likely to suffer more from price increases than are less price sensitive households higher along the income distribution.
Thomas Philippon, for instance, examines how certain competition might affect different points on the income distribution, using Amazon’s and Walmart’s emergence in the retail sector as examples.243Philippon, supra note 129, at 39–44. He argues that Walmart’s market to the entry drove retail prices down, while Amazon’s entry corresponded with efforts to enhance (and transform) the shopping experience.244Id. at 39 (“[A]s Walmart’s market share increased, retail prices decreased sharply. . . . The growth of Amazon coincides with constant prices. This means that Amazon’s expansion is not about cutting prices. Instead, Amazon is all about improving the shopping experience.”). He further contends that while “Walmart created more value for lower-income households,” “Amazon is more valuable for upper middle-class households whose disposable income and opportunity cost of time are relatively high.”245Id. at 40. He cites to research estimating that some of gains from e-commerce related to savings on travel costs; and that higher income cardholders and consumers in densely populated areas gained more. Philippon concludes that, “Clearly, Amazon is great for busy, high-earning households.”246Id. at 43.
This example again highlights that the benefits of competition (or lack thereof) might differentially impact households along the income distribution. And that not all benefits to competition necessarily flow proportionately across the spectrum, or flow disproportionately to those on the lower ends. In some cases, the benefits might flow more readily to those in the middle- or upper- portions, depending upon several factors. As noted above, the fundamental notion undergirding competition (and competition laws) is that competitive environments create growth—they make the pie bigger, so to speak. It is not that all growth necessarily occurs equally at all moments; but rather that over time, it is likely to improve welfare overall.247See, e.g., id. at 21.
Antitrust enforcement actions focusing upon necessities would tend to free up more of their resources (including both time and income) for other endeavors, thereby placing more within their reach. Thus, prioritizing cases in which basic goods and services are at issue would likely tend to benefit lower income households more greatly, and to contribute more directly to equity than other cases in which the distribution of benefits might be more mixed across the population.
Another critical point is the issue of rent seeking which, as alluded to above, is one that repeatedly arises in the work on income inequality, but has a very particular history within antitrust law and enforcement. A comprehensive discussion of this issues is outside the scope of this Article, but a brief interlude seems warranted. Rent seeking is often credited—rightly so—with distorting outcomes. Stiglitz, for instance, argues that rent seeking contributes to inequality by taking “money from the rest of society and redistribut[ing] it to the top.”248Stiglitz, supra note 8, at 47. This is absolutely one important means by which rent seeking behavior may play out.
But rent seeking is not constrained to top income earners. Nor do the “benefits,” or rents, from rent-seeking behavior always flow to the top.249See, e.g., Philippon, supra note 129, at 21 (“The interplay between rents and inequality means that competition does not always reduce inequality. Competition can make some income-sharing agreements more difficult to sustain. For instance, a business might agree to share some of its rents with its workers. Similarly, competition for talent can push the earnings of some groups to very high levels.”). Many special interests groups engage in rent seeking—frequently, trade associations or similar groups representing certain special interests will argue their rent seeking is warranted precisely because they are not among the top earners and deserve assistance.250See generally Todd Zywicki, Rent-Seeking, Crony Capitalism, and the Crony Constitution, 23 Sup. Ct. Econ. Rev. 77 (2015). Antitrust law historically proved unusually susceptible to rent-seeking behavior, because early statutes and enforcement had all the hallmarks for such abuse. Early antitrust law was obscure and inconsistently enforced, and it was nearly impossible for courts to hold the agencies accountable for their decisions—the absence of both transparency and accountability tend to provide an environment ripe of rent seeking. Moreover, the threat of antitrust liability, and its treble damages, renders antitrust especially appealing to unhappy competitors seeking to wound their rivals. Thus, the antitrust field observed numerous attempts (some successful) at rent seeking over the years—not all of which benefited the top of the income distribution, specifically. Some more than others tended to destroy competition and harm consumers while protecting various special interests, which were not always the super wealthy.
When considering how rent-seeking behavior affects antitrust law and enforcement, specifically, extra care and consideration for this history should be taken. Rent seeking has potentially devastating distorting effects, and avoiding such distortions is critical to maintaining competitive markets that benefit consumers.
Conclusion
For over a century, the notion that antitrust enforcement and wealth equality are intimately related has remained a persuasive and persistent one. Despite being longstanding, the particulars of how this relationship functions, and affects real world trends at work today or over the last several decades, have remained surprisingly underexplored. By compiling the foundational insights and work on income inequality and antitrust in one place, this Article seeks to provide a basis upon which further exploration and understanding may be built.